 Students
 Educators
State Assessment & STAAR Reports
When reviewing yearly STAAR assessments, or looking at accountability for your school, DMAC can help!
Scroll down for useful reports to disaggregate your data.
Important Tips!
- Archived Data – When generating reports for a previous school year, District and Campus accounts (not available for Teachers) can use the Teacher, Class, Student, Search or Group tabs and change the Source to Archive.
- Demographics – Select groups or individual demographics on the left of the report screen before generating any report with Demographic in the name (e.g., Item Analysis – Demographic).
- Student Names – Reports with Student in the name will list individual student results. They are available for all tabs aside from the District and Campus tabs.
Instructional Reports
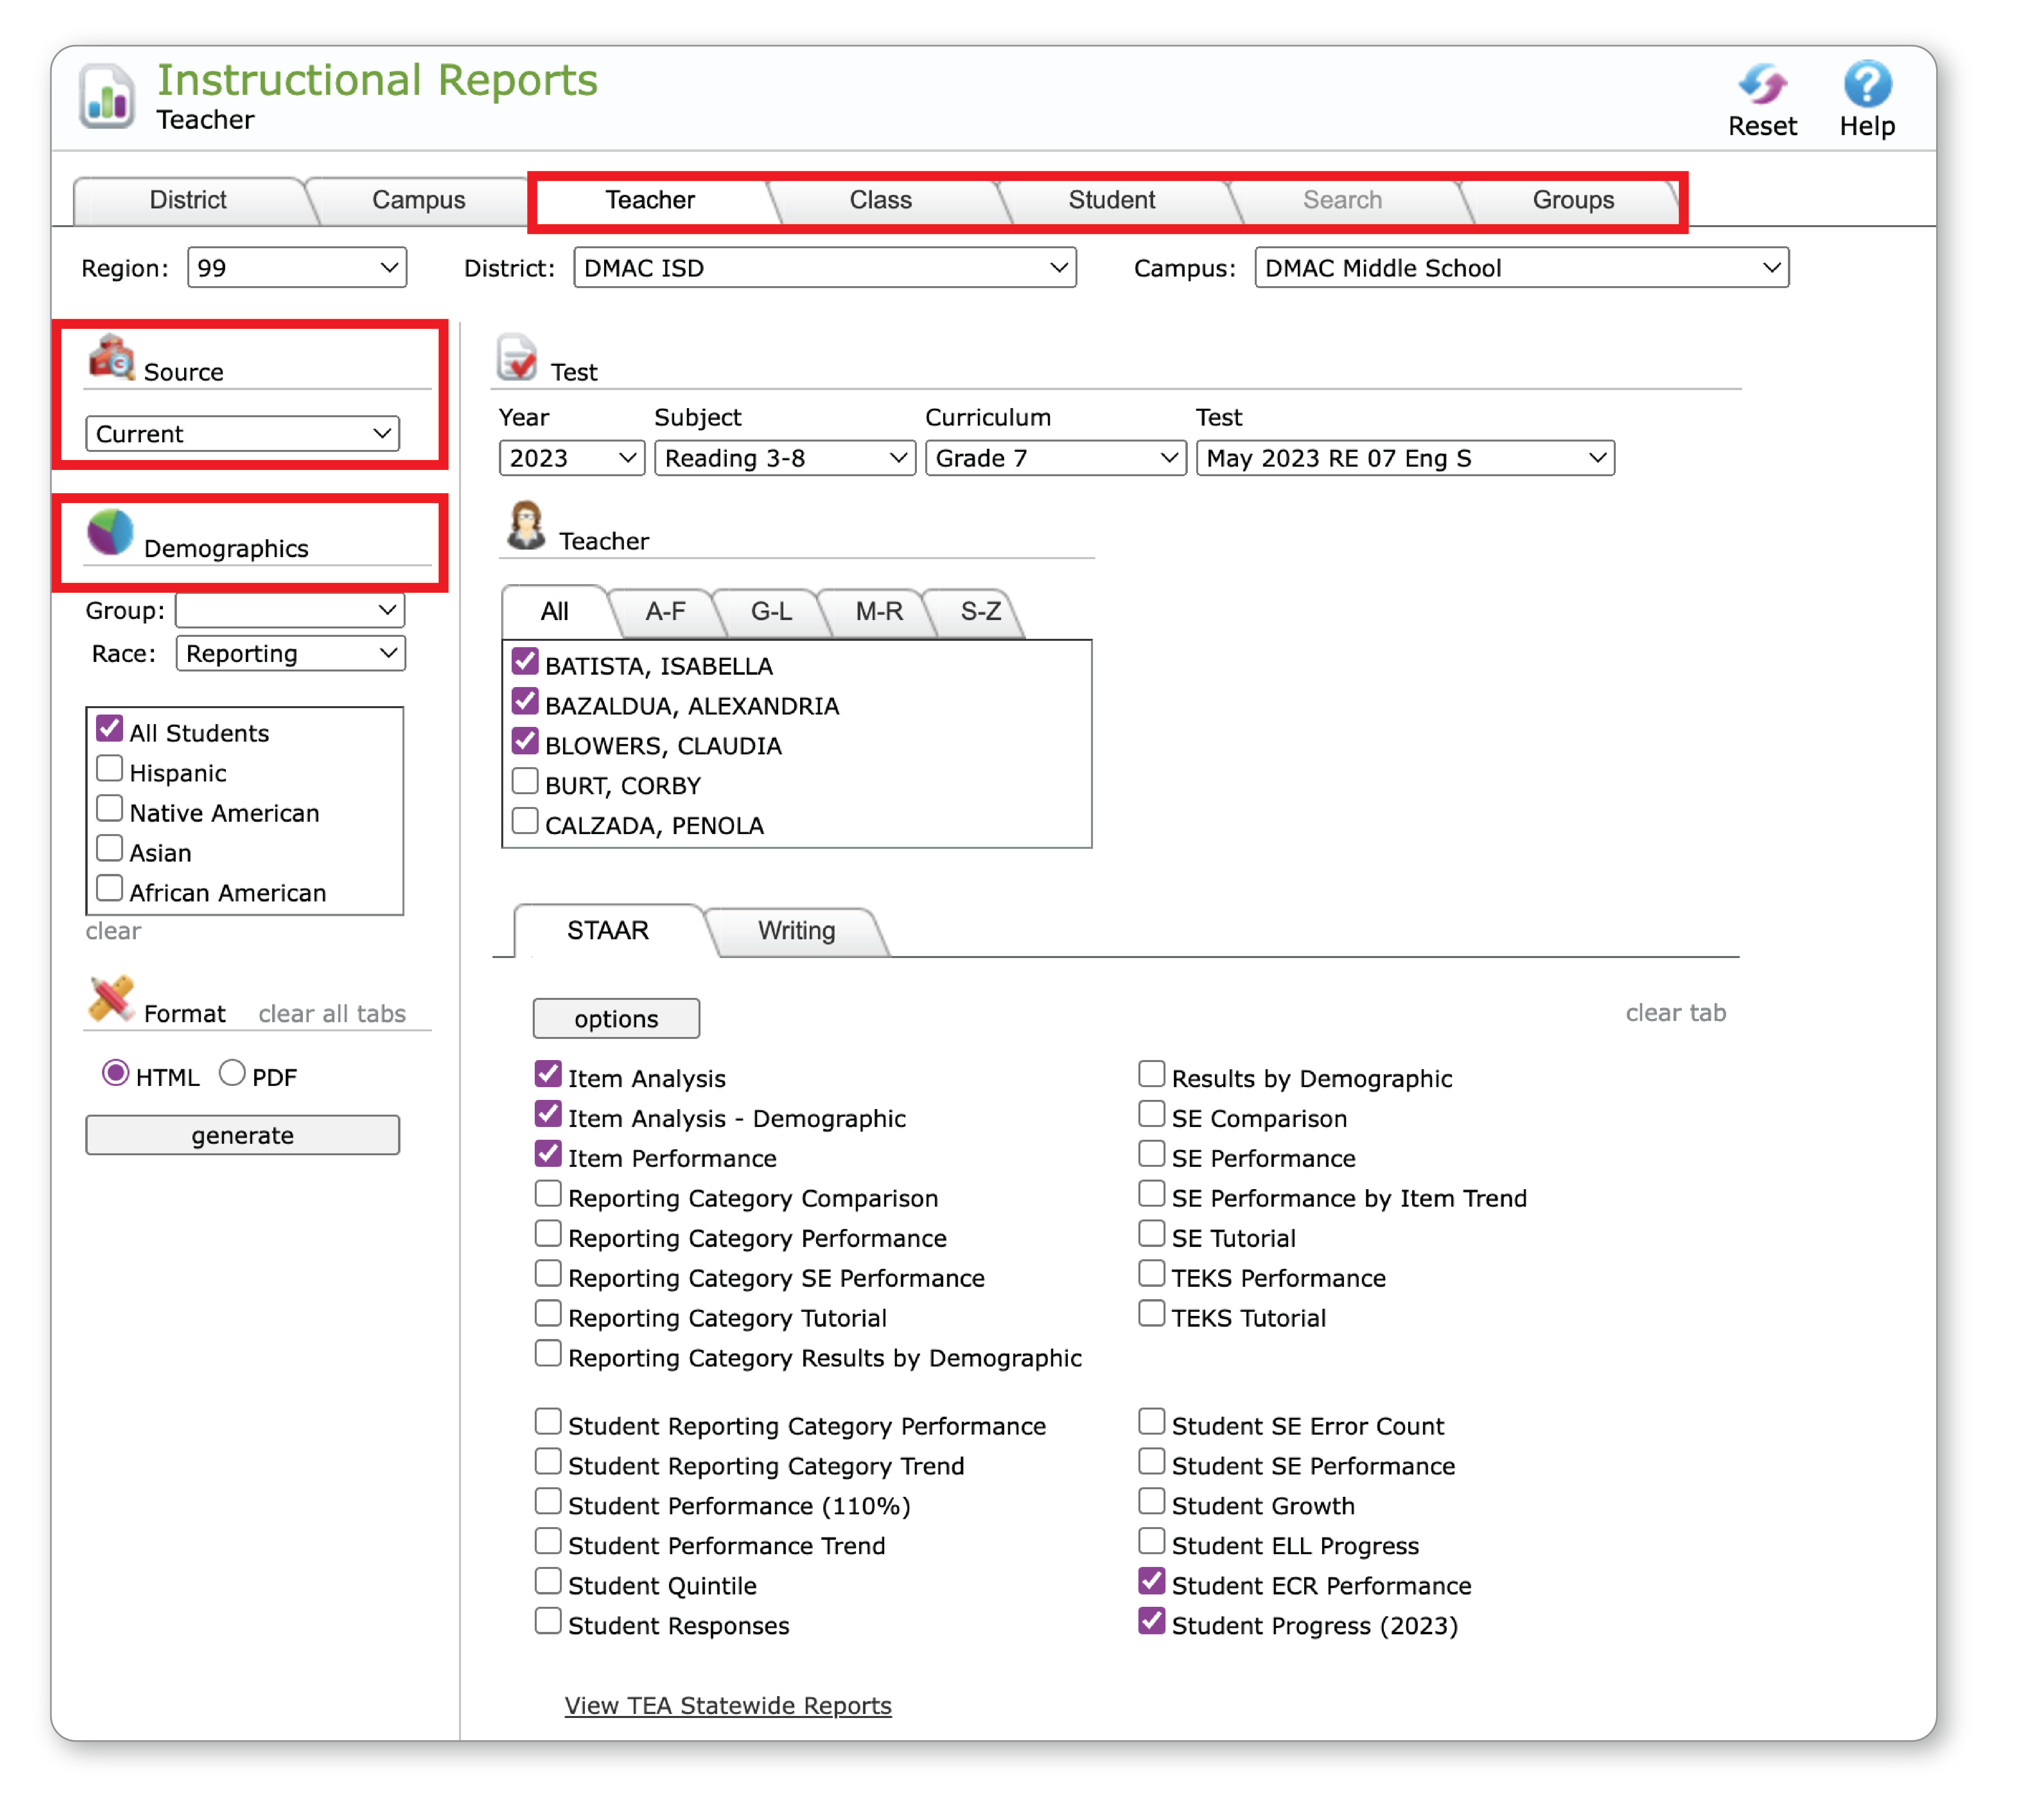
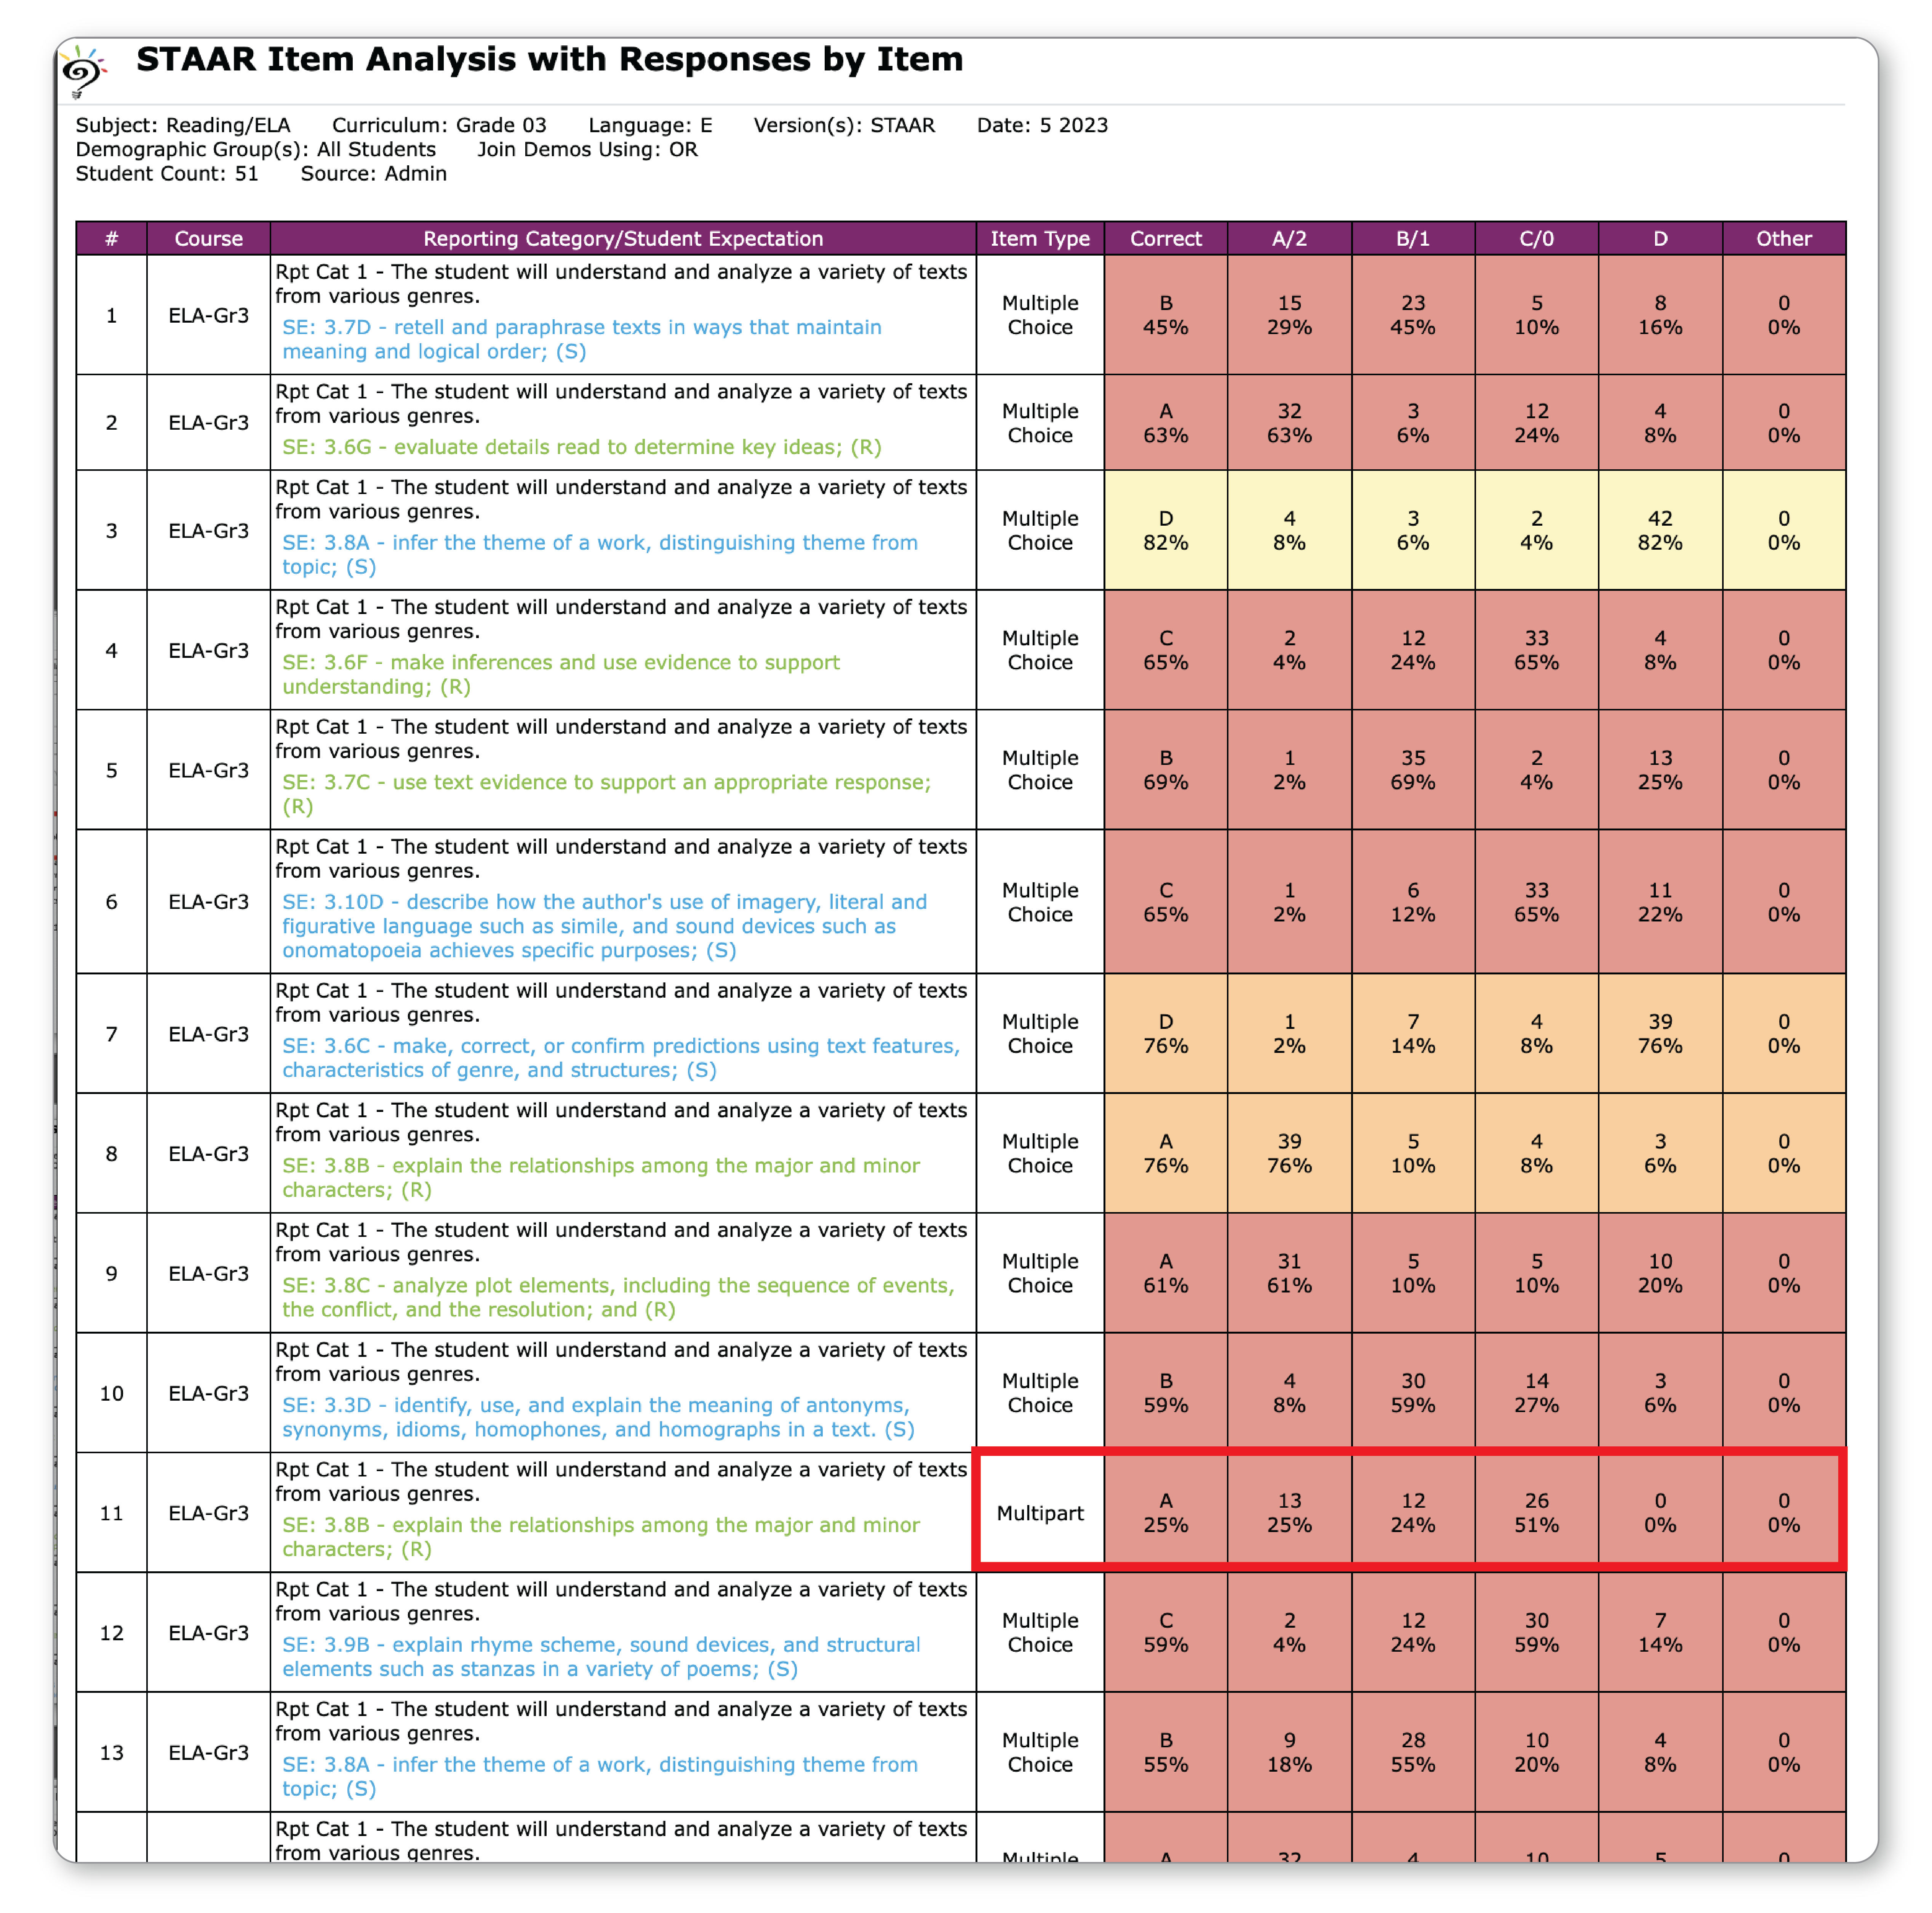
INSTRUCTIONAL | STAAR Item Analysis (with Responses by Item)
Item Types:
- Multiple Choice – Displays correct answer and percentage of each selected.
- New Item Types – Some new items are worth 2 points for items with multiple parts. To show this on the same report, use the columns to see the percent of students who received full credit – 2 (A/2 column), half credit – 1 (B/1 column), or no credit – 0 (C/0 column) points. The columns for D and Other display 0% for these item types.
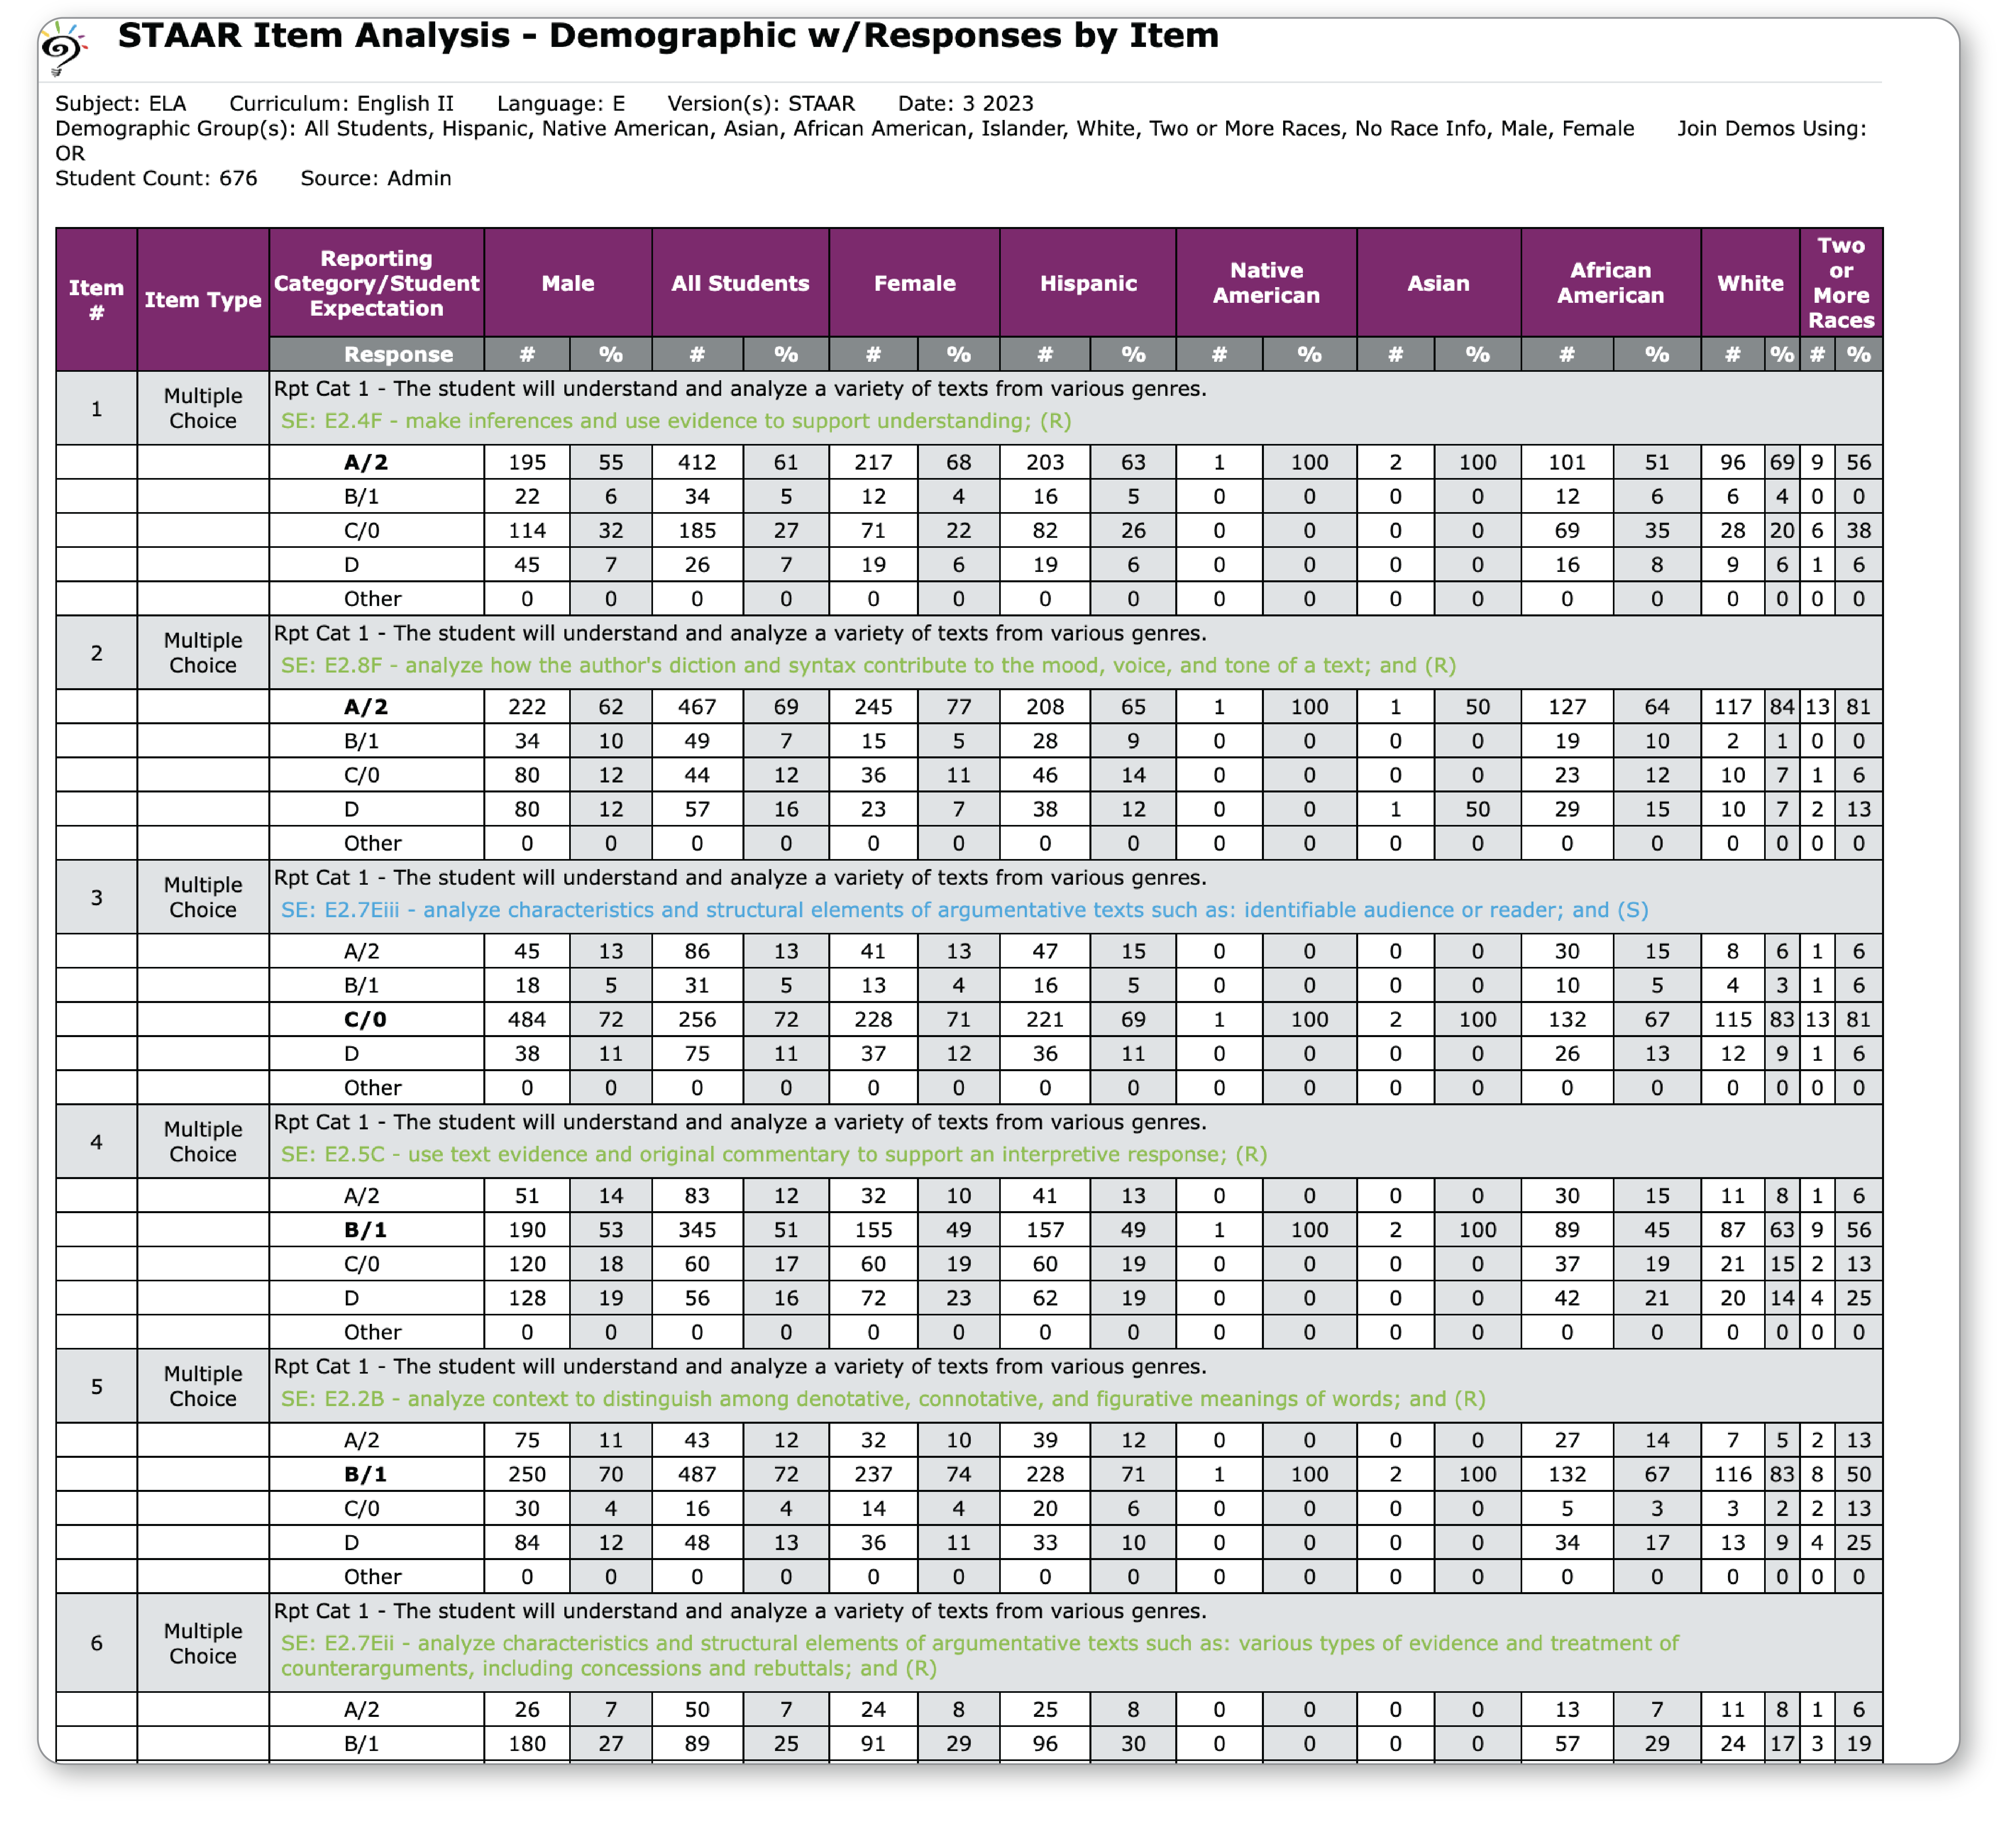
INSTRUCTIONAL | STAAR Item Analysis – Demographic with Responses by Item
This report shows the percent correct for each item given on the test broken down by selected demographics.
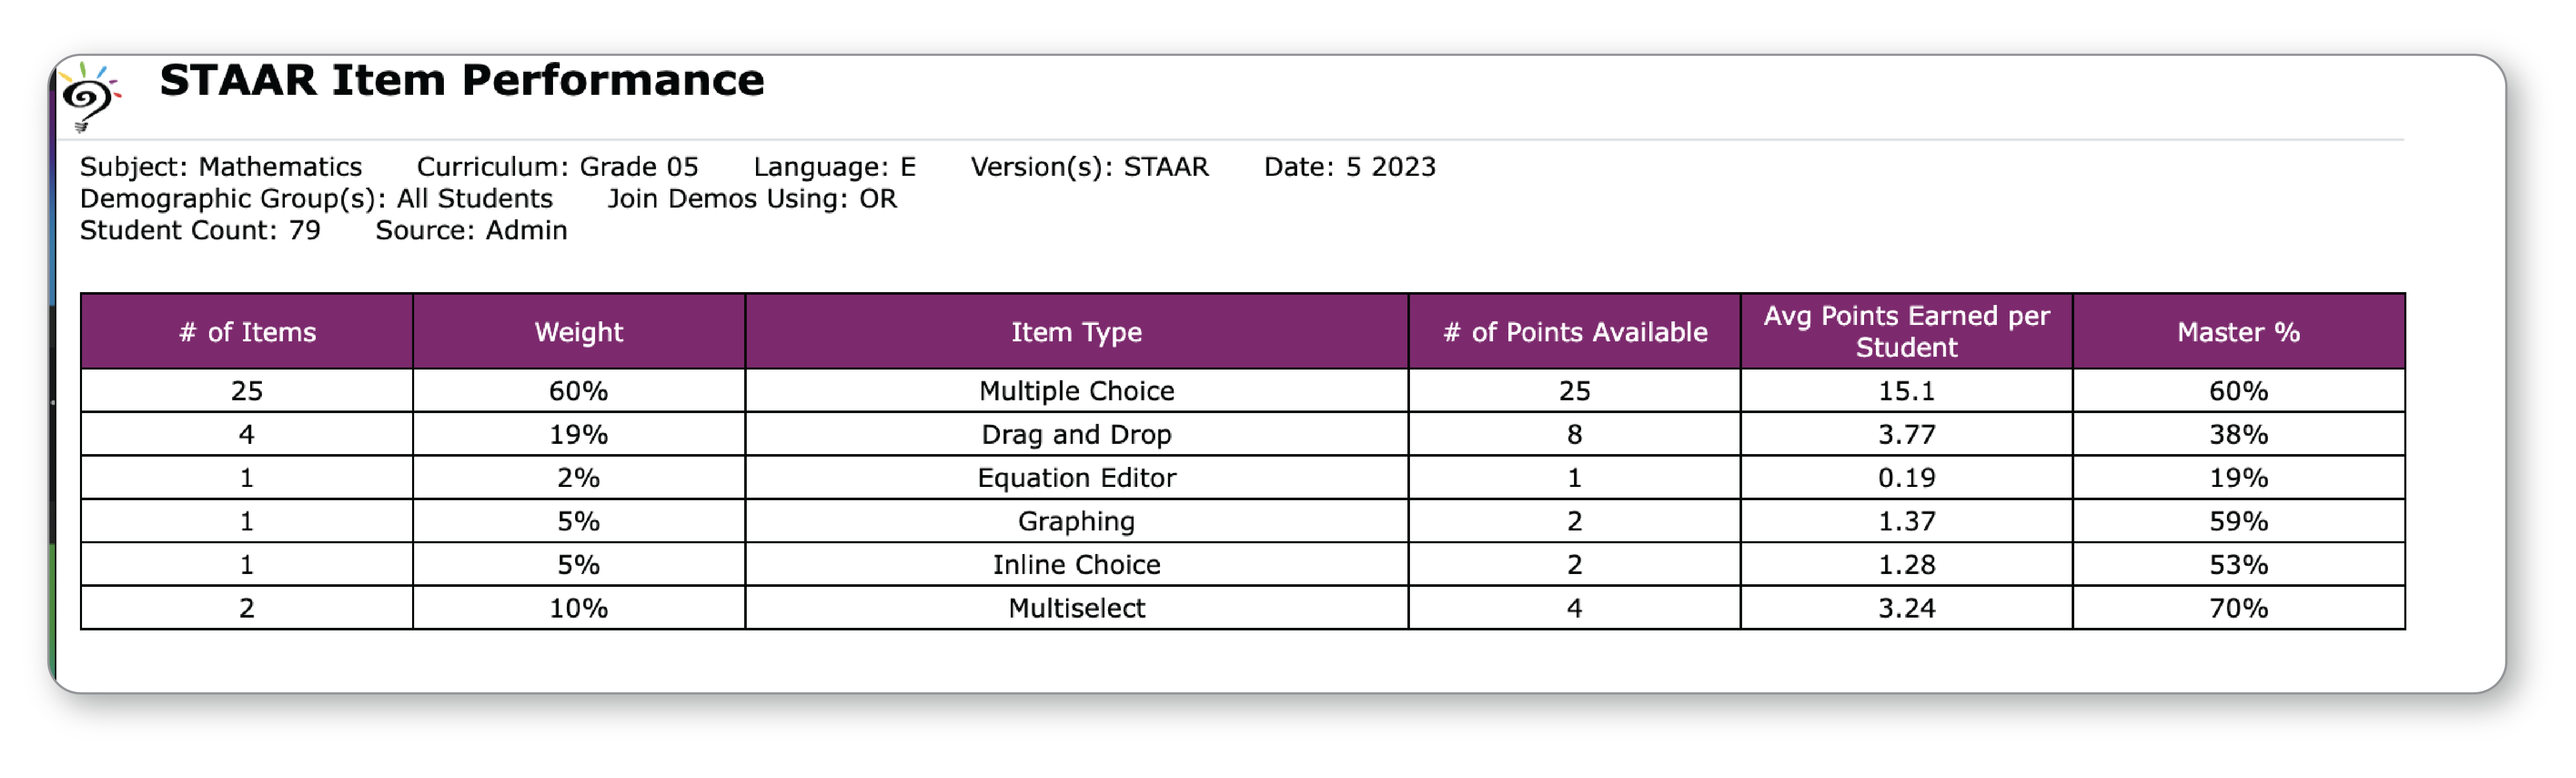
INSTRUCTIONAL | STAAR Item Performance
This report shows item types tested, cumulative weight of those item types on the test, number of points available, average points earned by students, and percent of students that mastered that item. (Mastery is set at 2 points for all non ECR and non Multiple Choice items). This is helpful in determining student performance by item type to isolate areas where students may be able to grow.
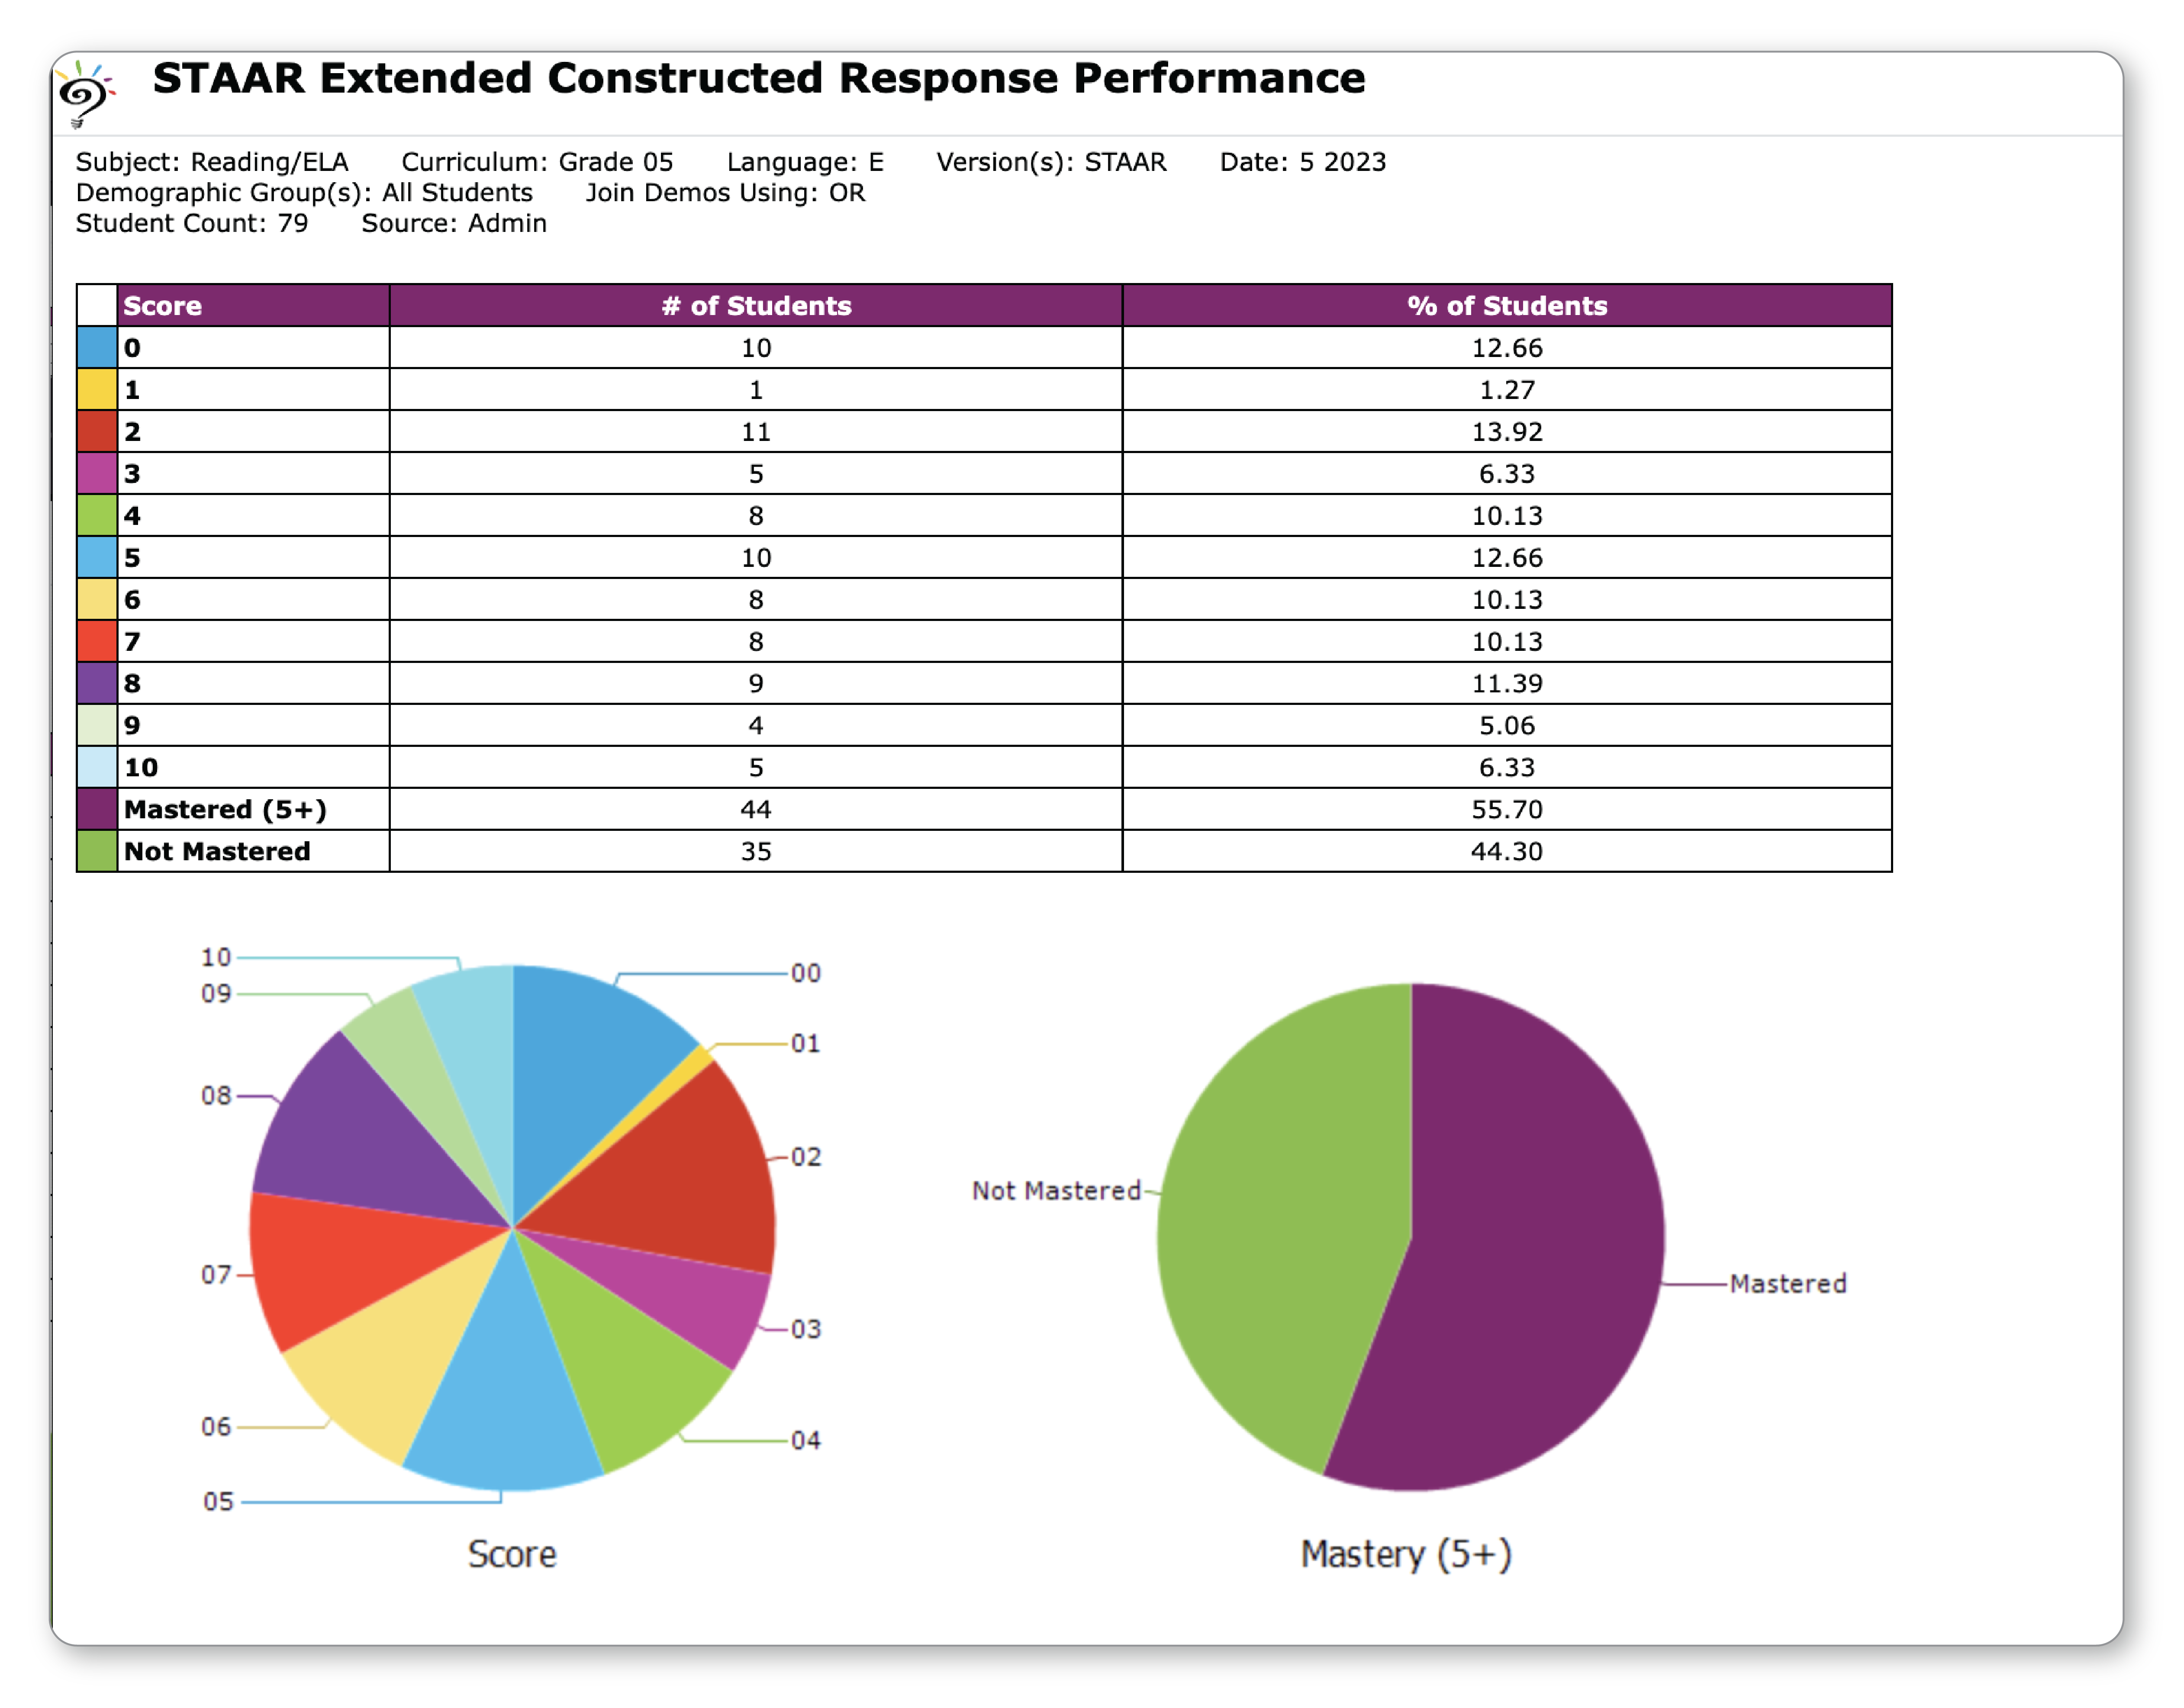
INSTRUCTIONAL | STAAR Extended Constructed Response Performance
This report breaks down the number and percentage of students at each score on the Extended Constructed Response item and can be pulled from the district and campus tabs. Mastery of the item is defaulted to 5 and displayed on the report. Mastery can be adjusted higher or lower in Options.
INSTRUCTIONAL | Student Progress (2023)
That report is to give a comparison from 2022 to 2023 on Performance level indicator. The CSV download includes information for which test would have earned points for growth based on performance. This can be used to determine Teacher growth based on STAAR results.
Trend Report
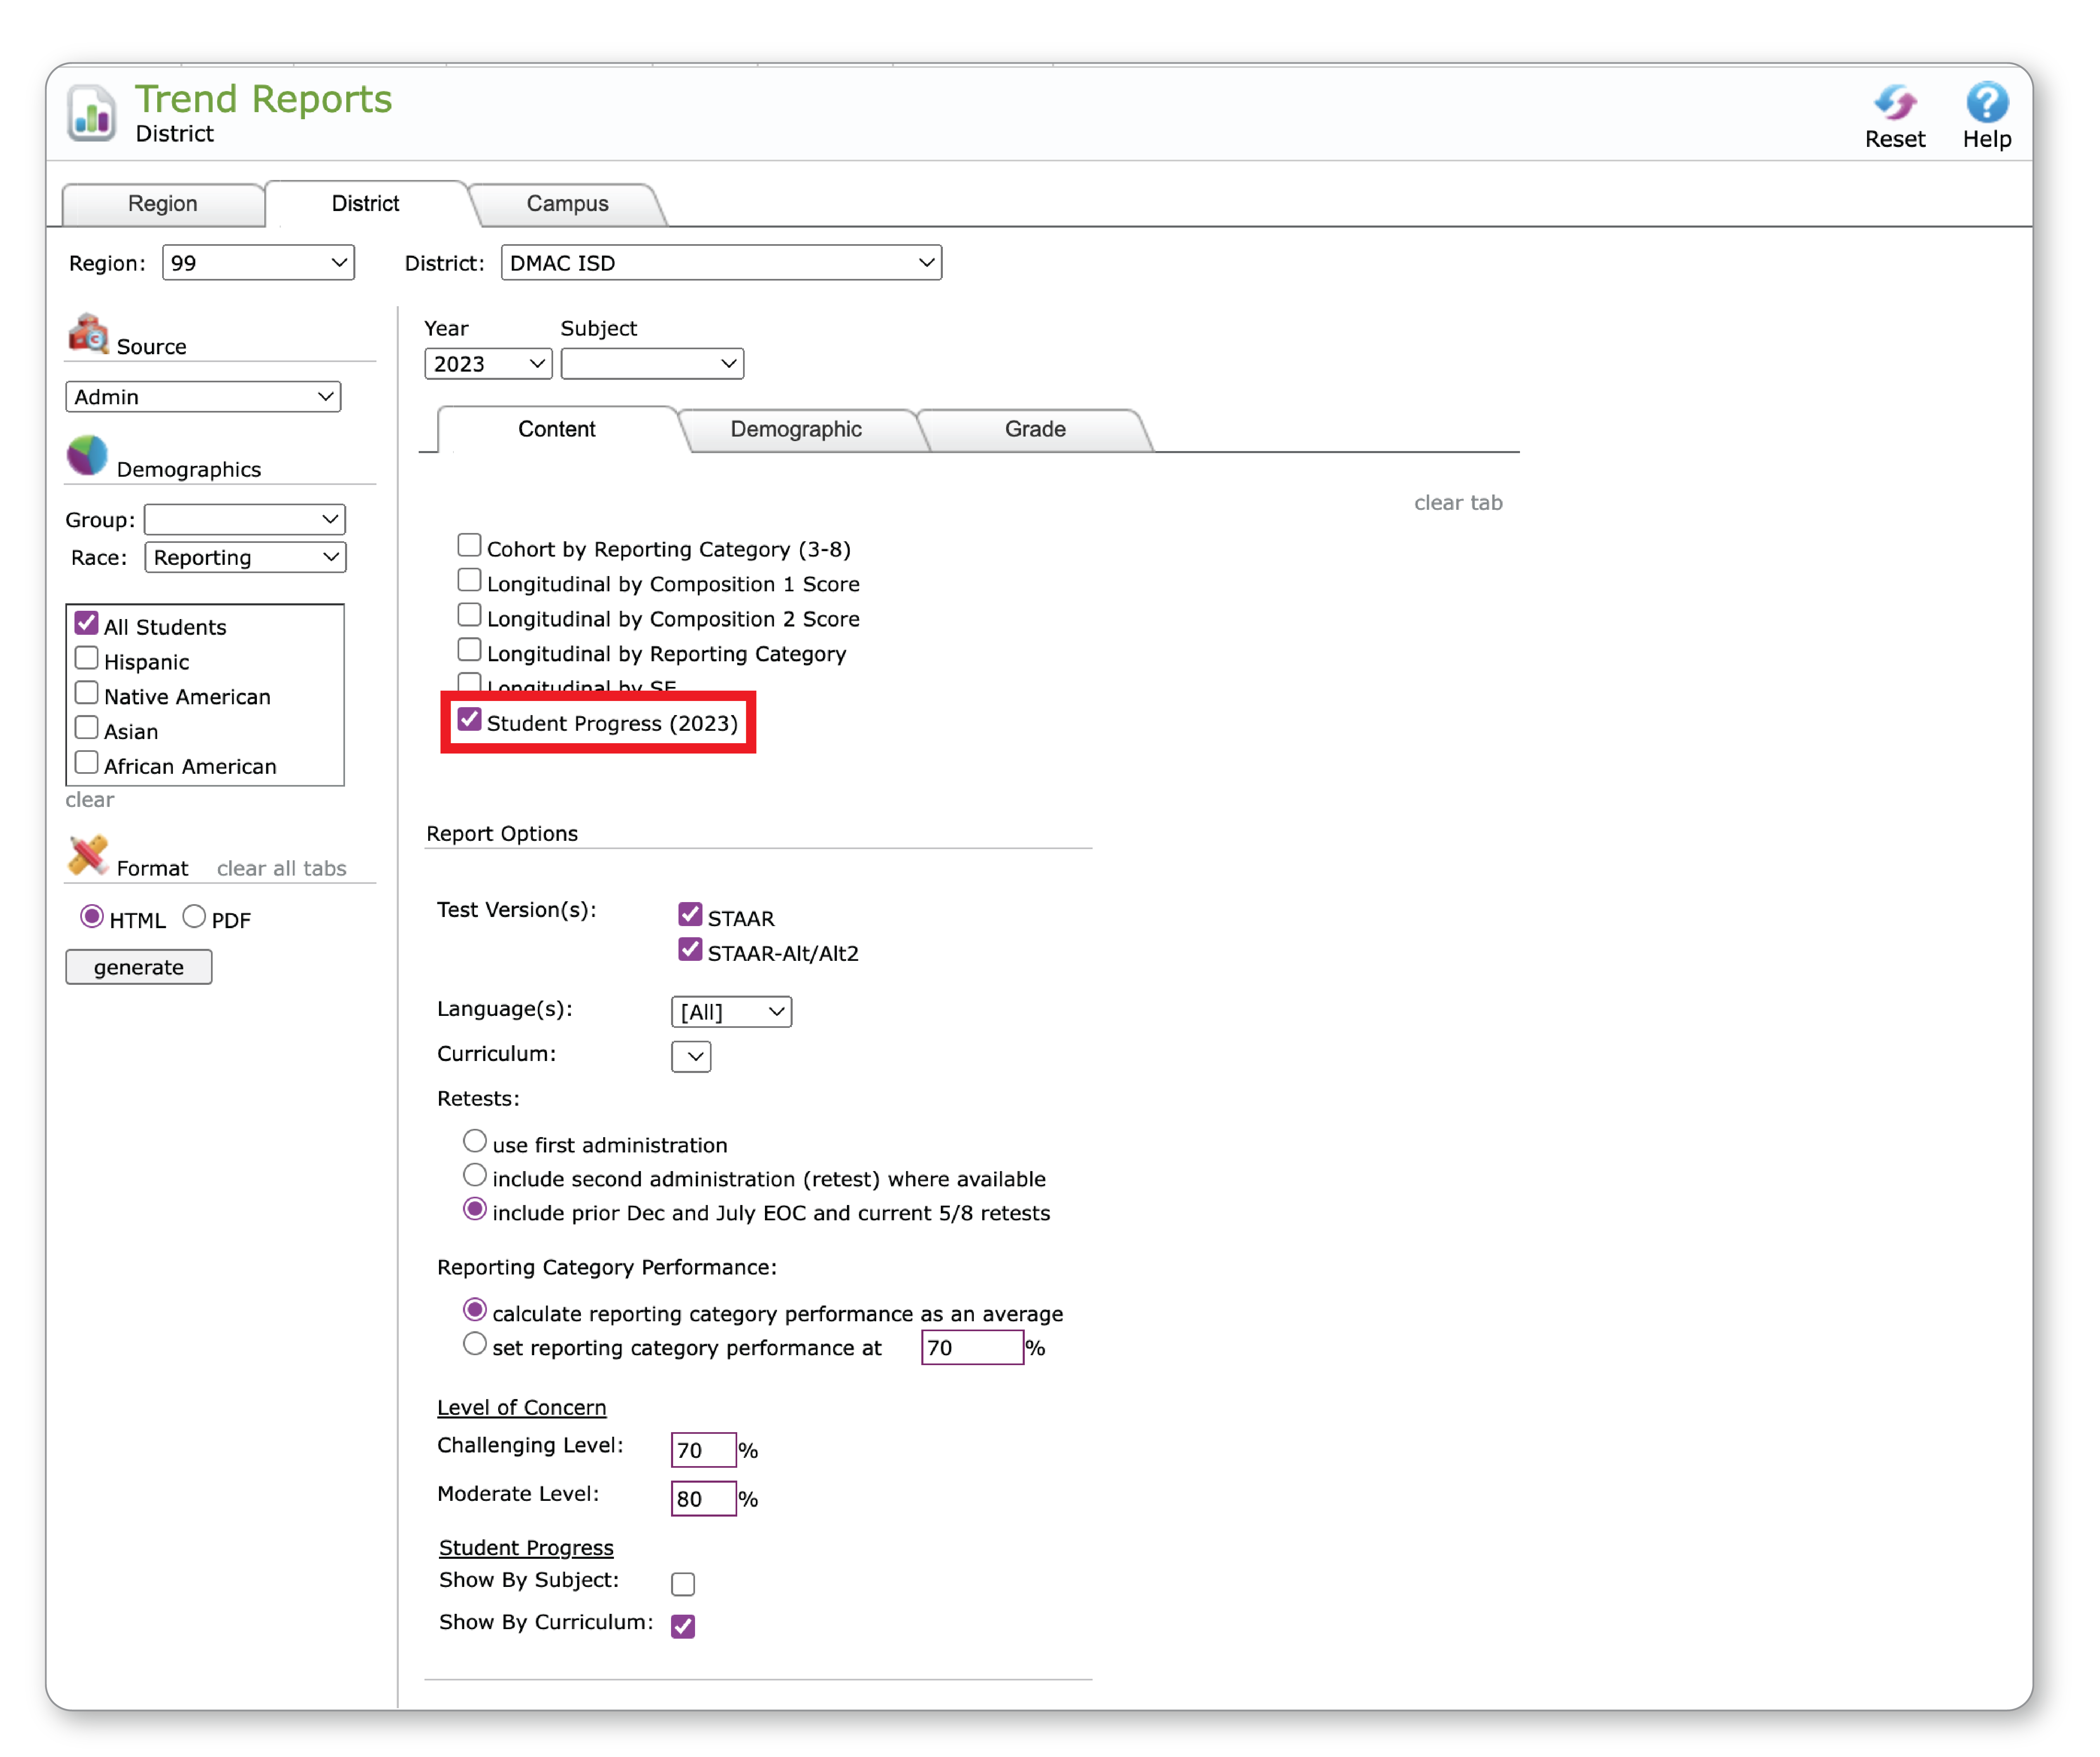
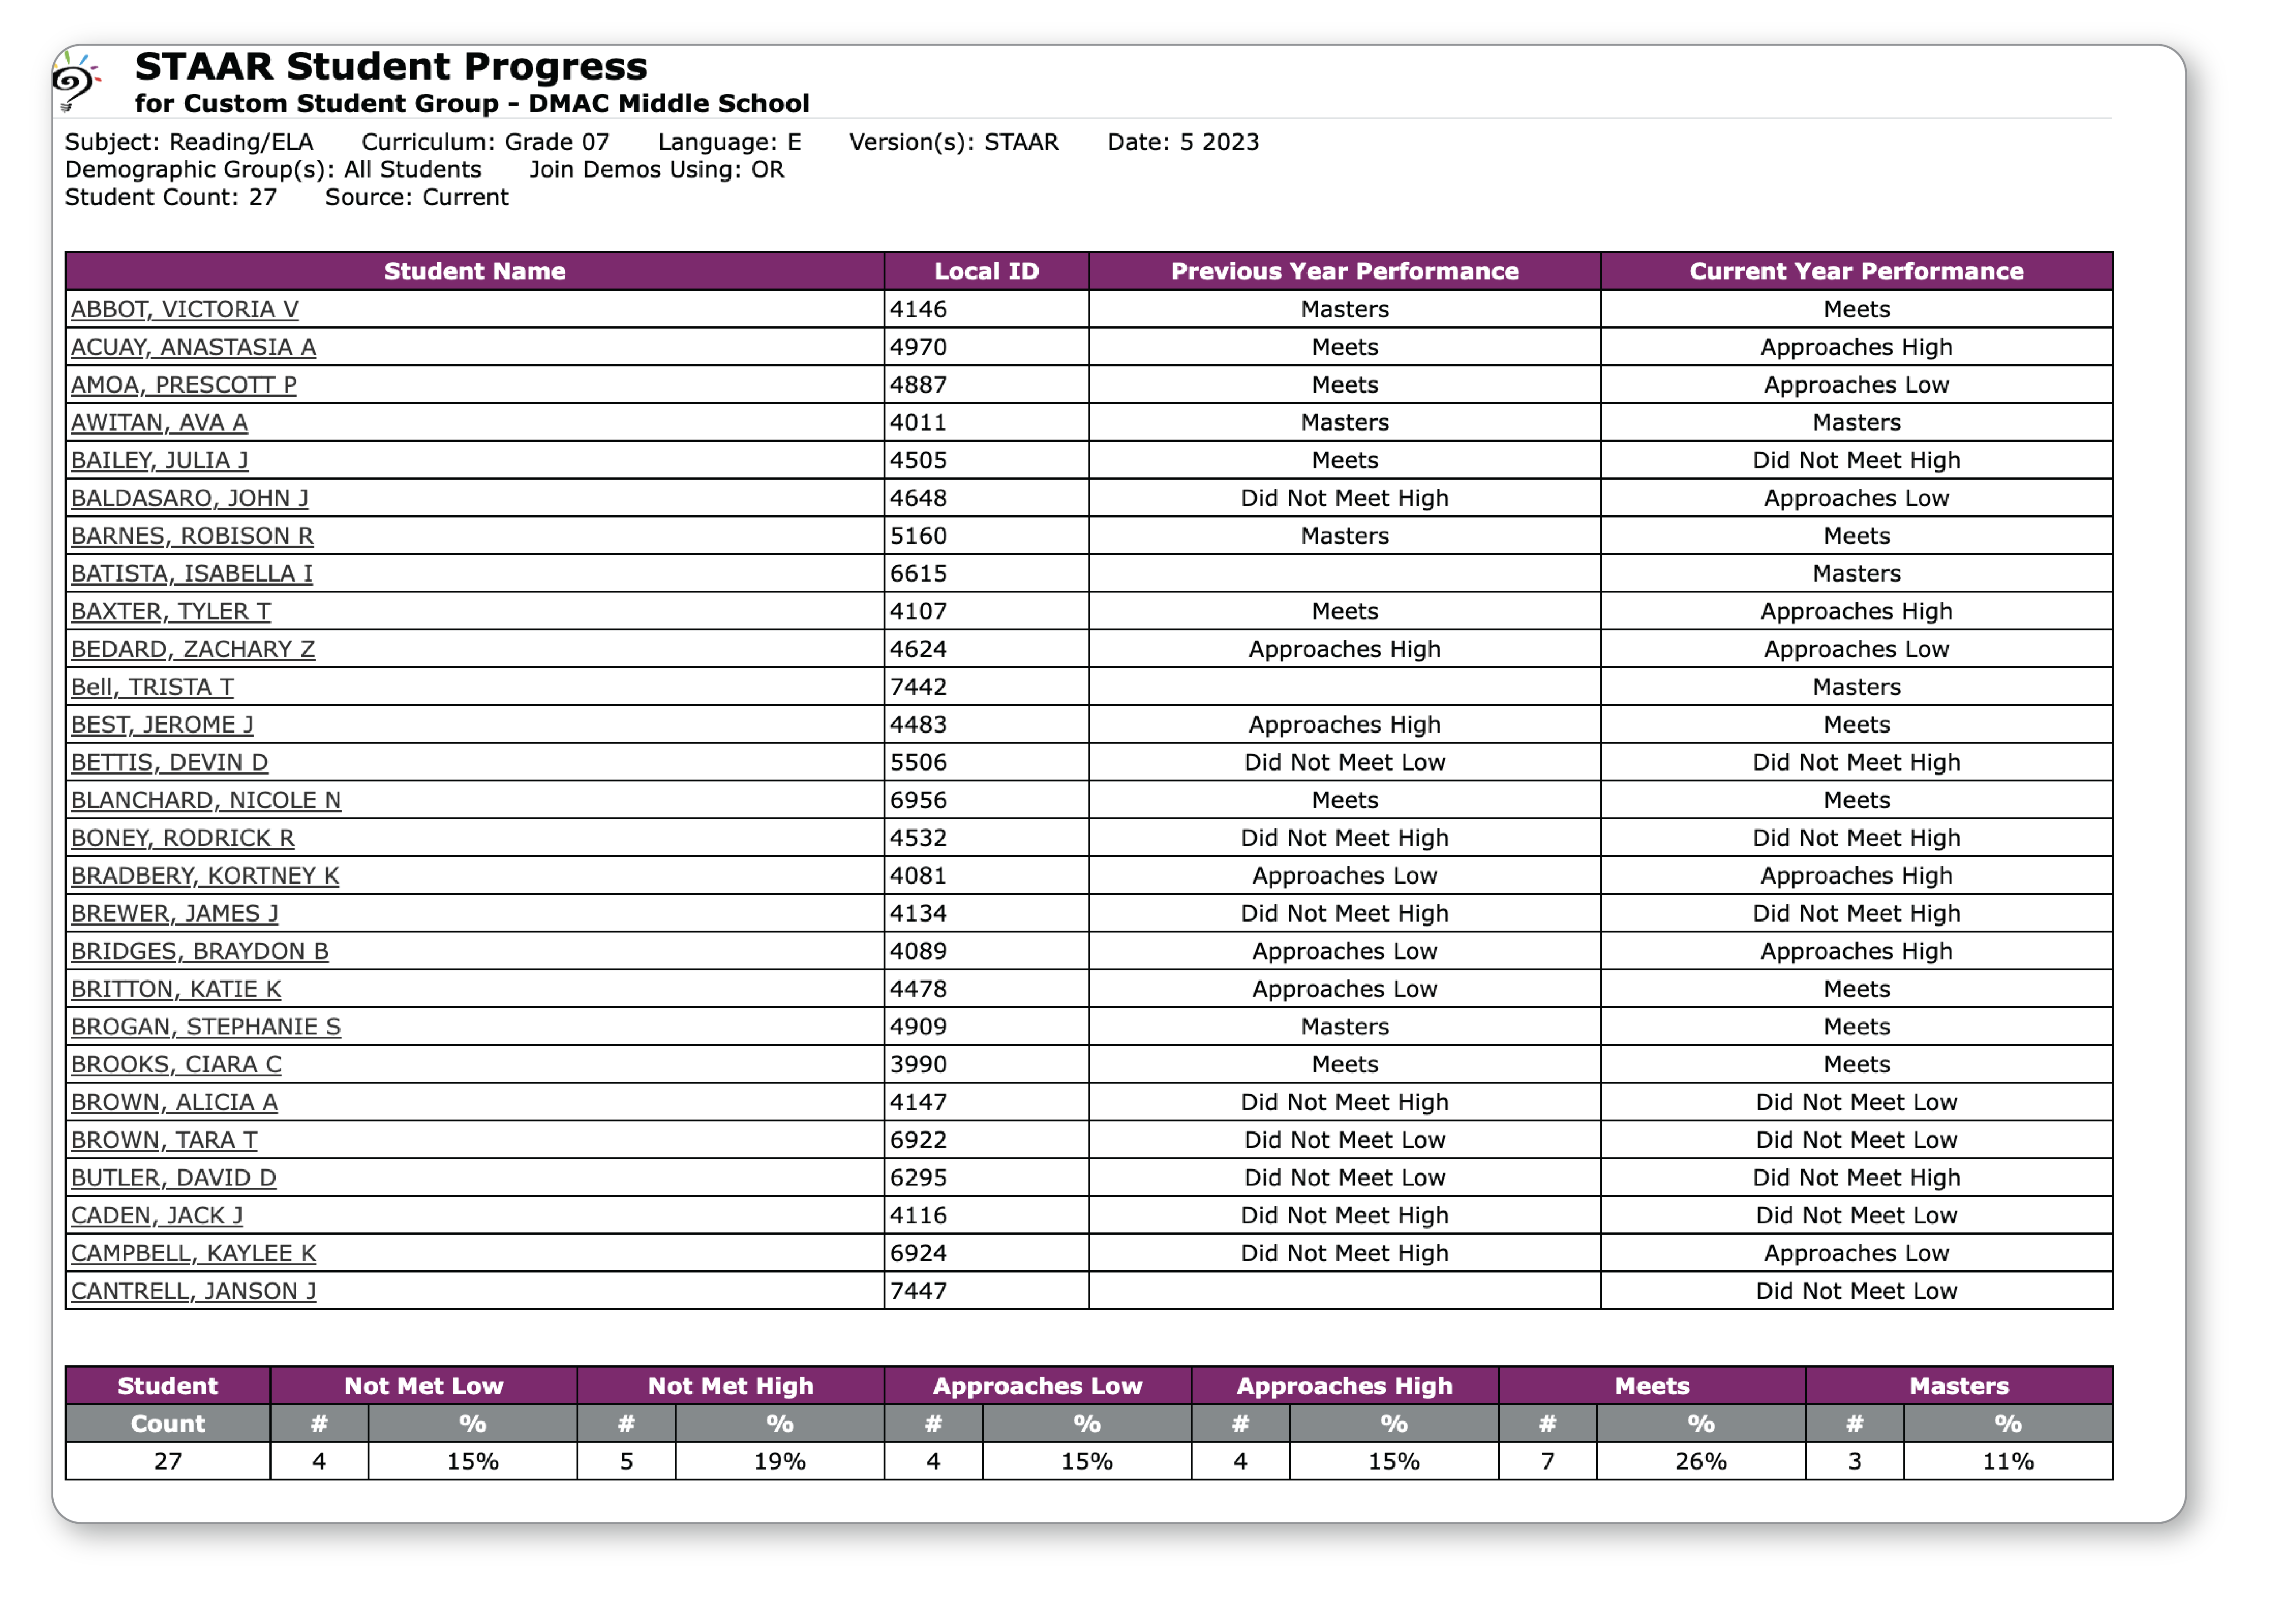
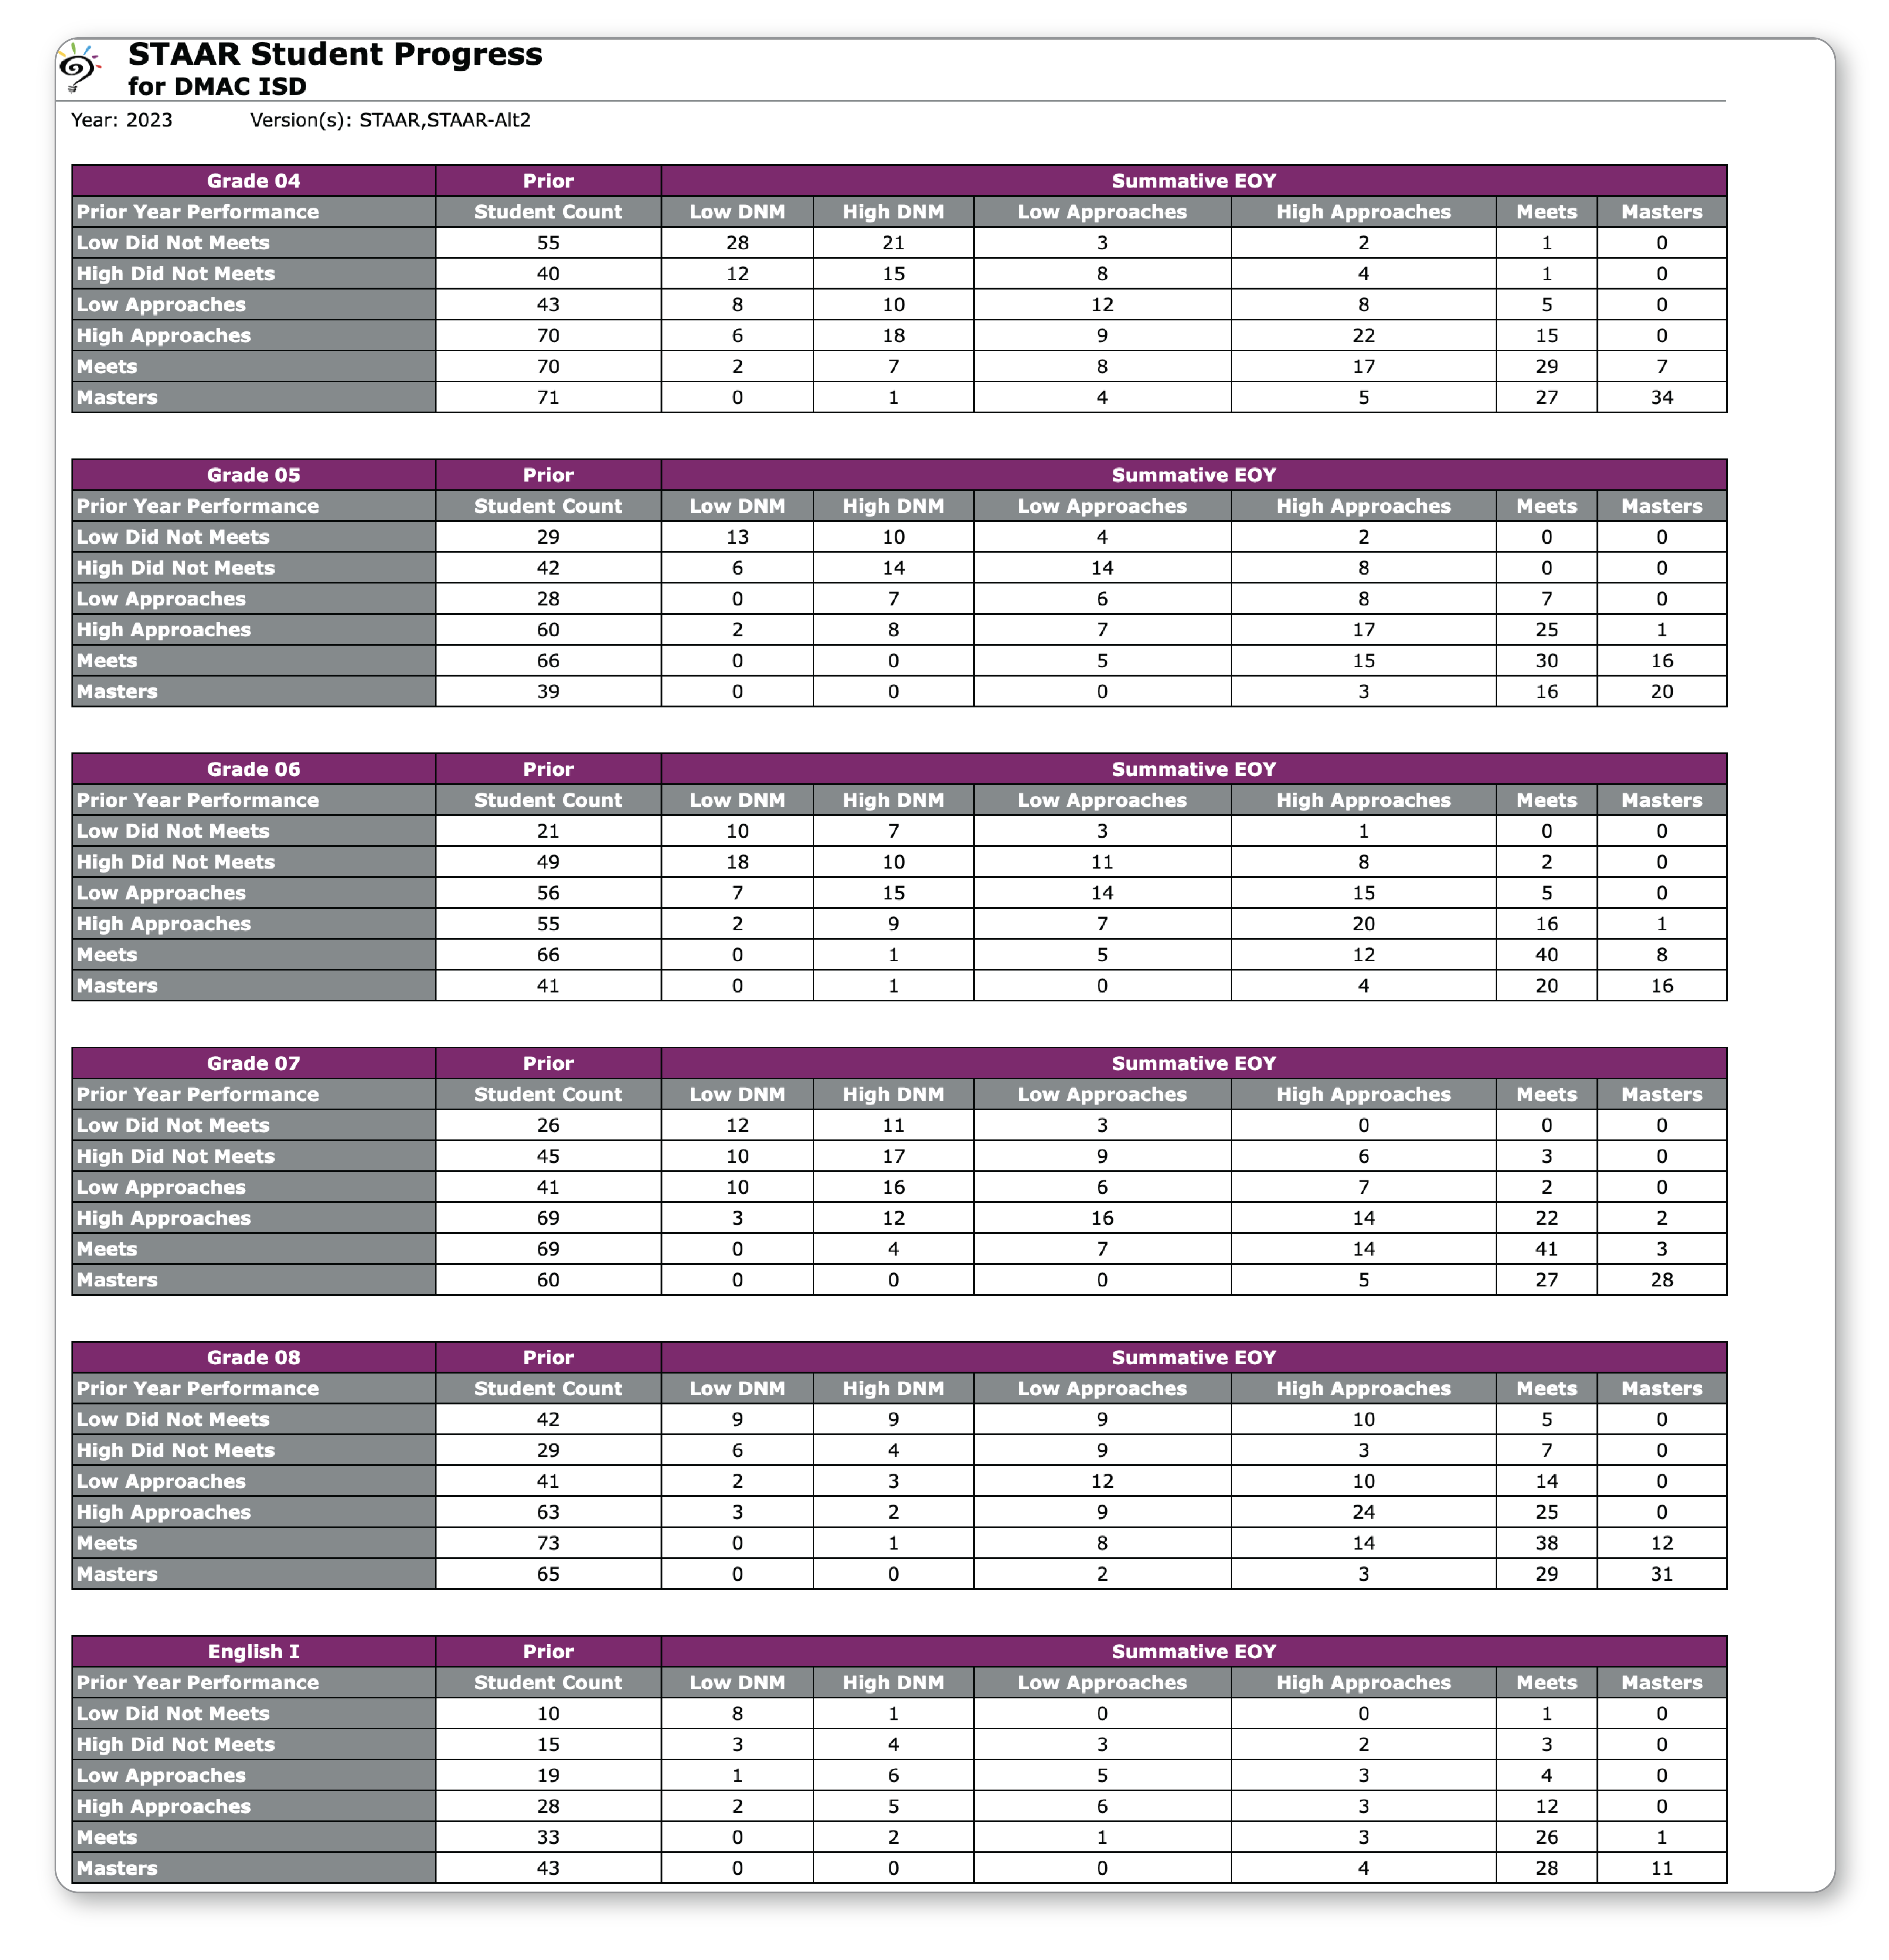
TREND | STAAR Student Progress
This report gives districts a closer look at student growth in the unique 2023 assessment year. View prior year performance compared to current year performance (Summative EOY). This report can help districts and campuses identify areas of growth or areas of concern. Export to CSV to provide a list of student names with performance comparison by student. Select Show by Subject and/or Show by Curriculum to view by Subject and/or grade level.
Demographic Reports – BETA Accountability
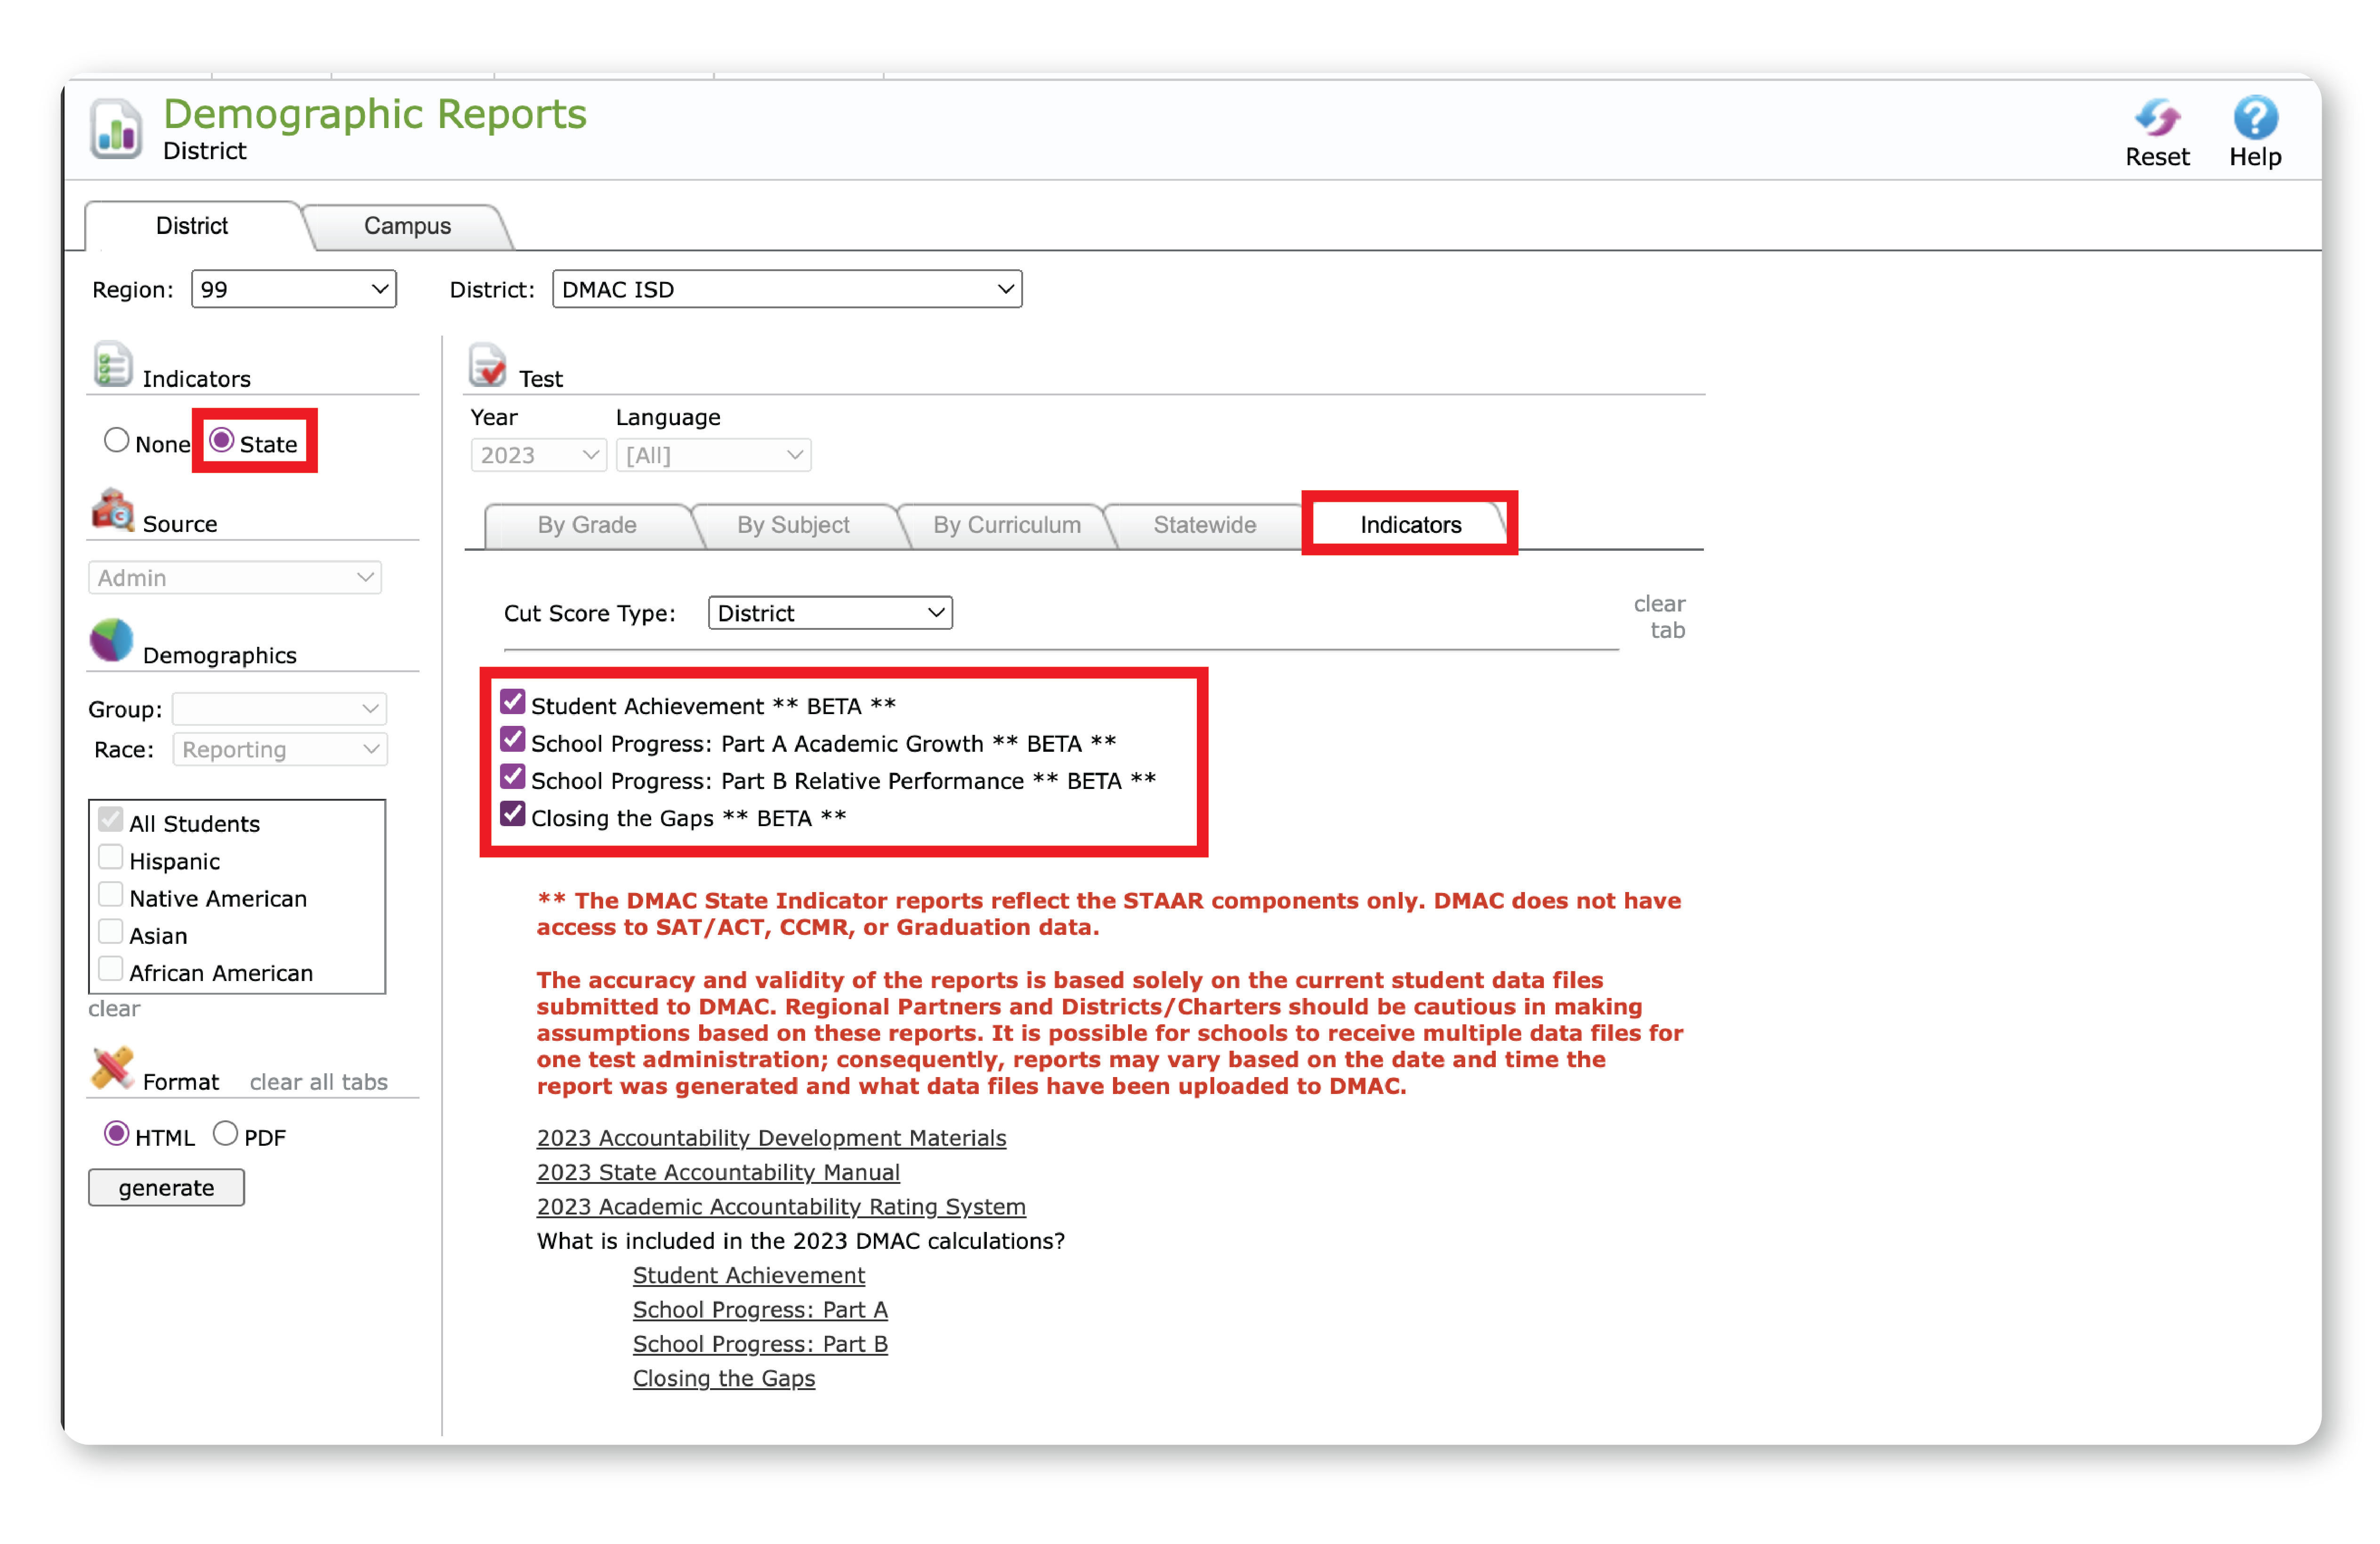
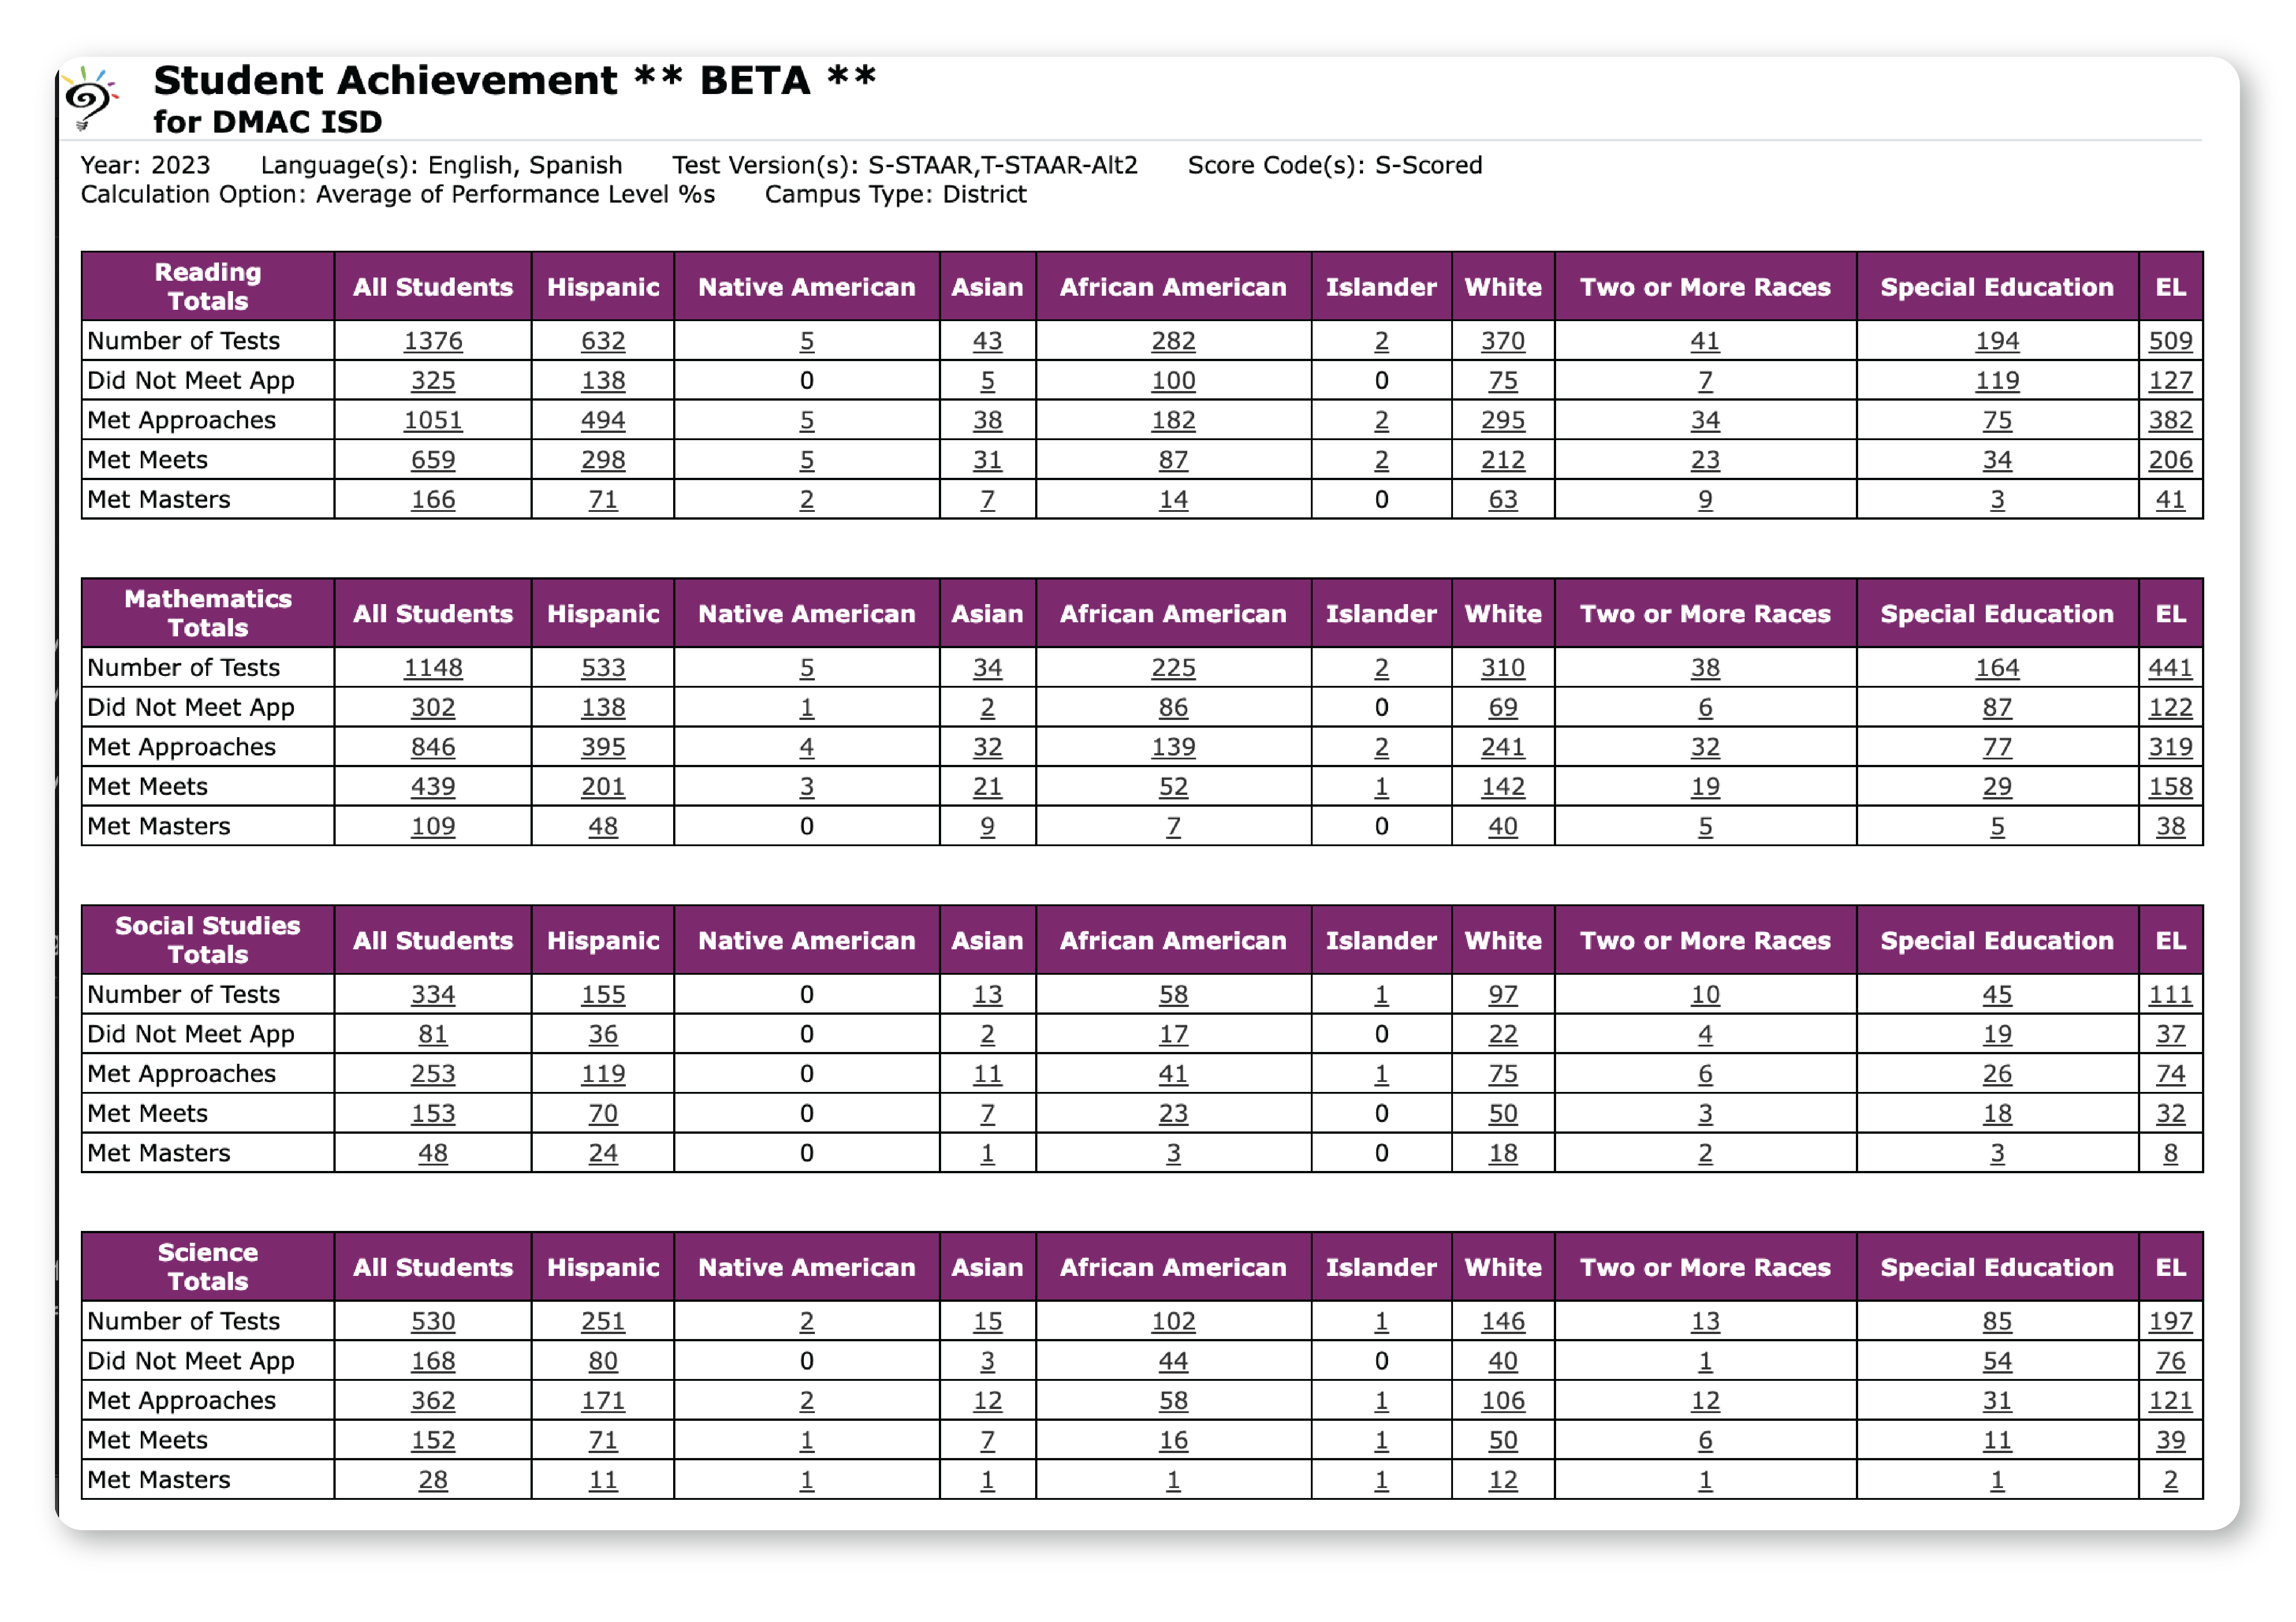
DEMOGRAPHIC | Student Achievement
This report evaluates campus performance based on student achievement performance on STAAR assessments for Elementary and Middle Schools, and STAAR Assessments, College, Career, and Military Rediness (CCMR) indicators, and graduation rates for high schools and K-12s. This report looks at the accountability subset of students across all tested areas.
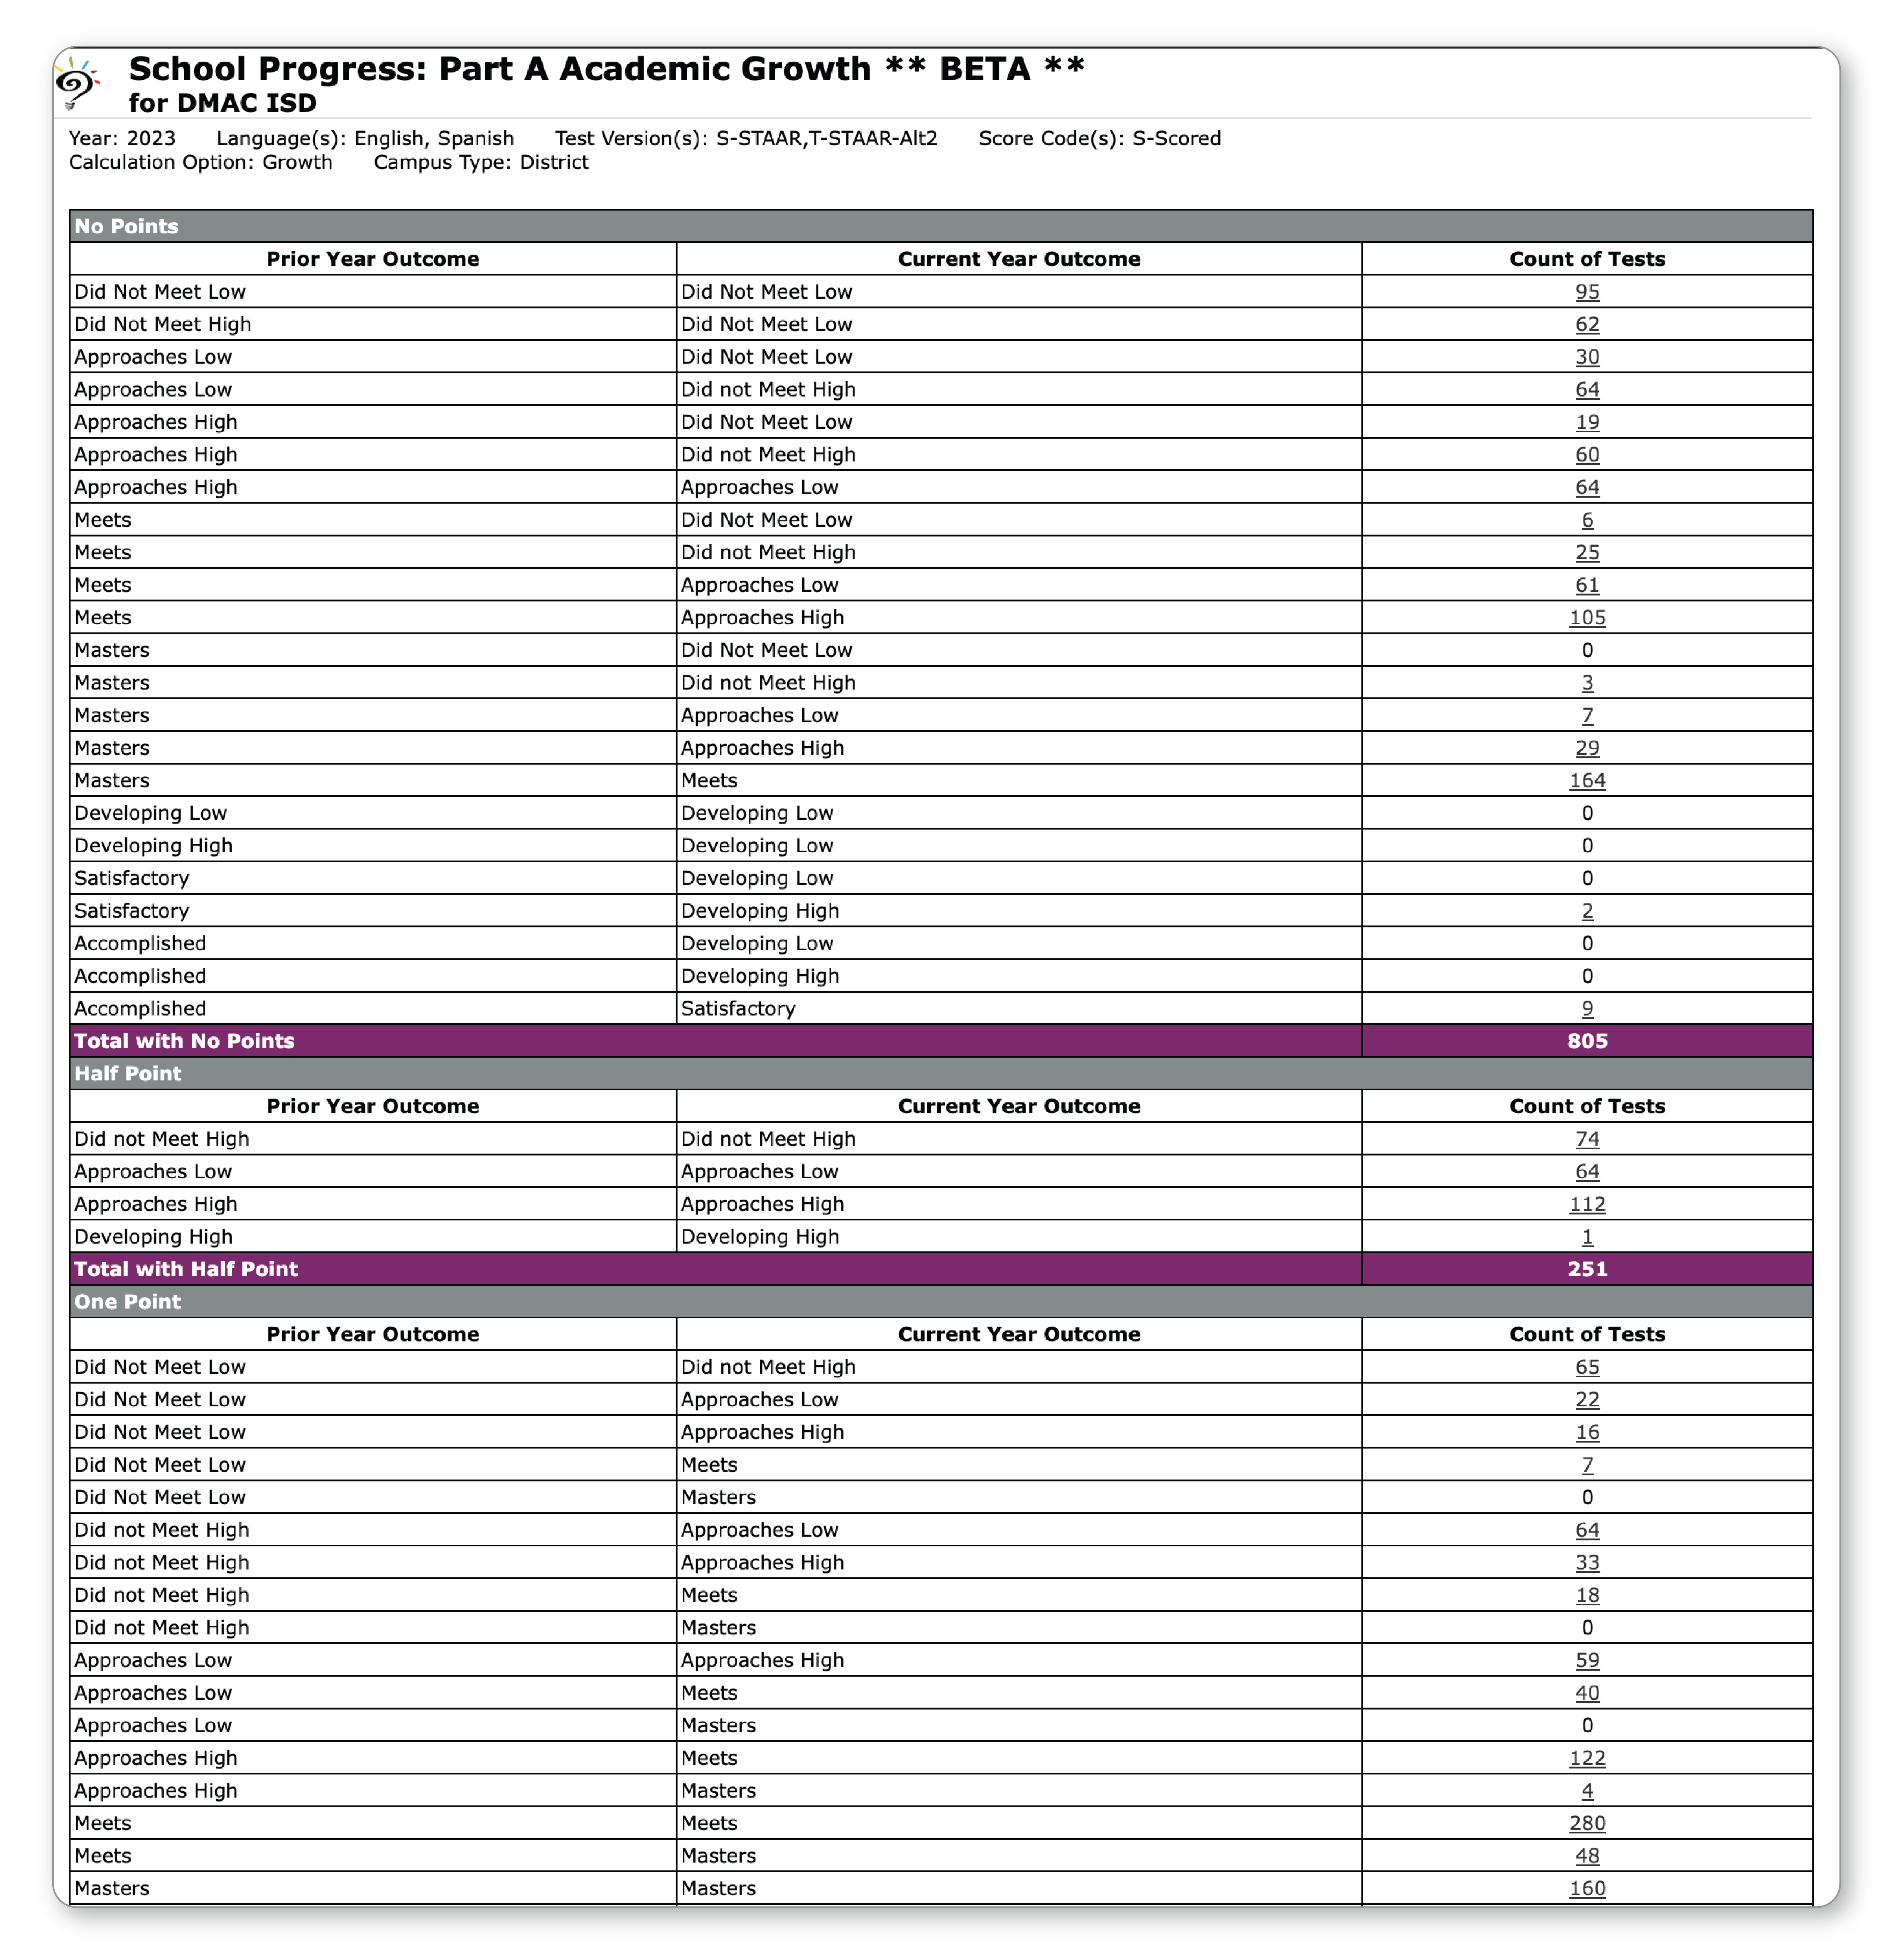
DEMOGRAPHIC | School Progress: Part A Academic Growth
This report shows STAAR Performance in Reading/Language Arts (RLA) and Mathematics that show annual growth and/or demonstrate accelerated learning. Export to CSV to download a list of students reflected in the report.
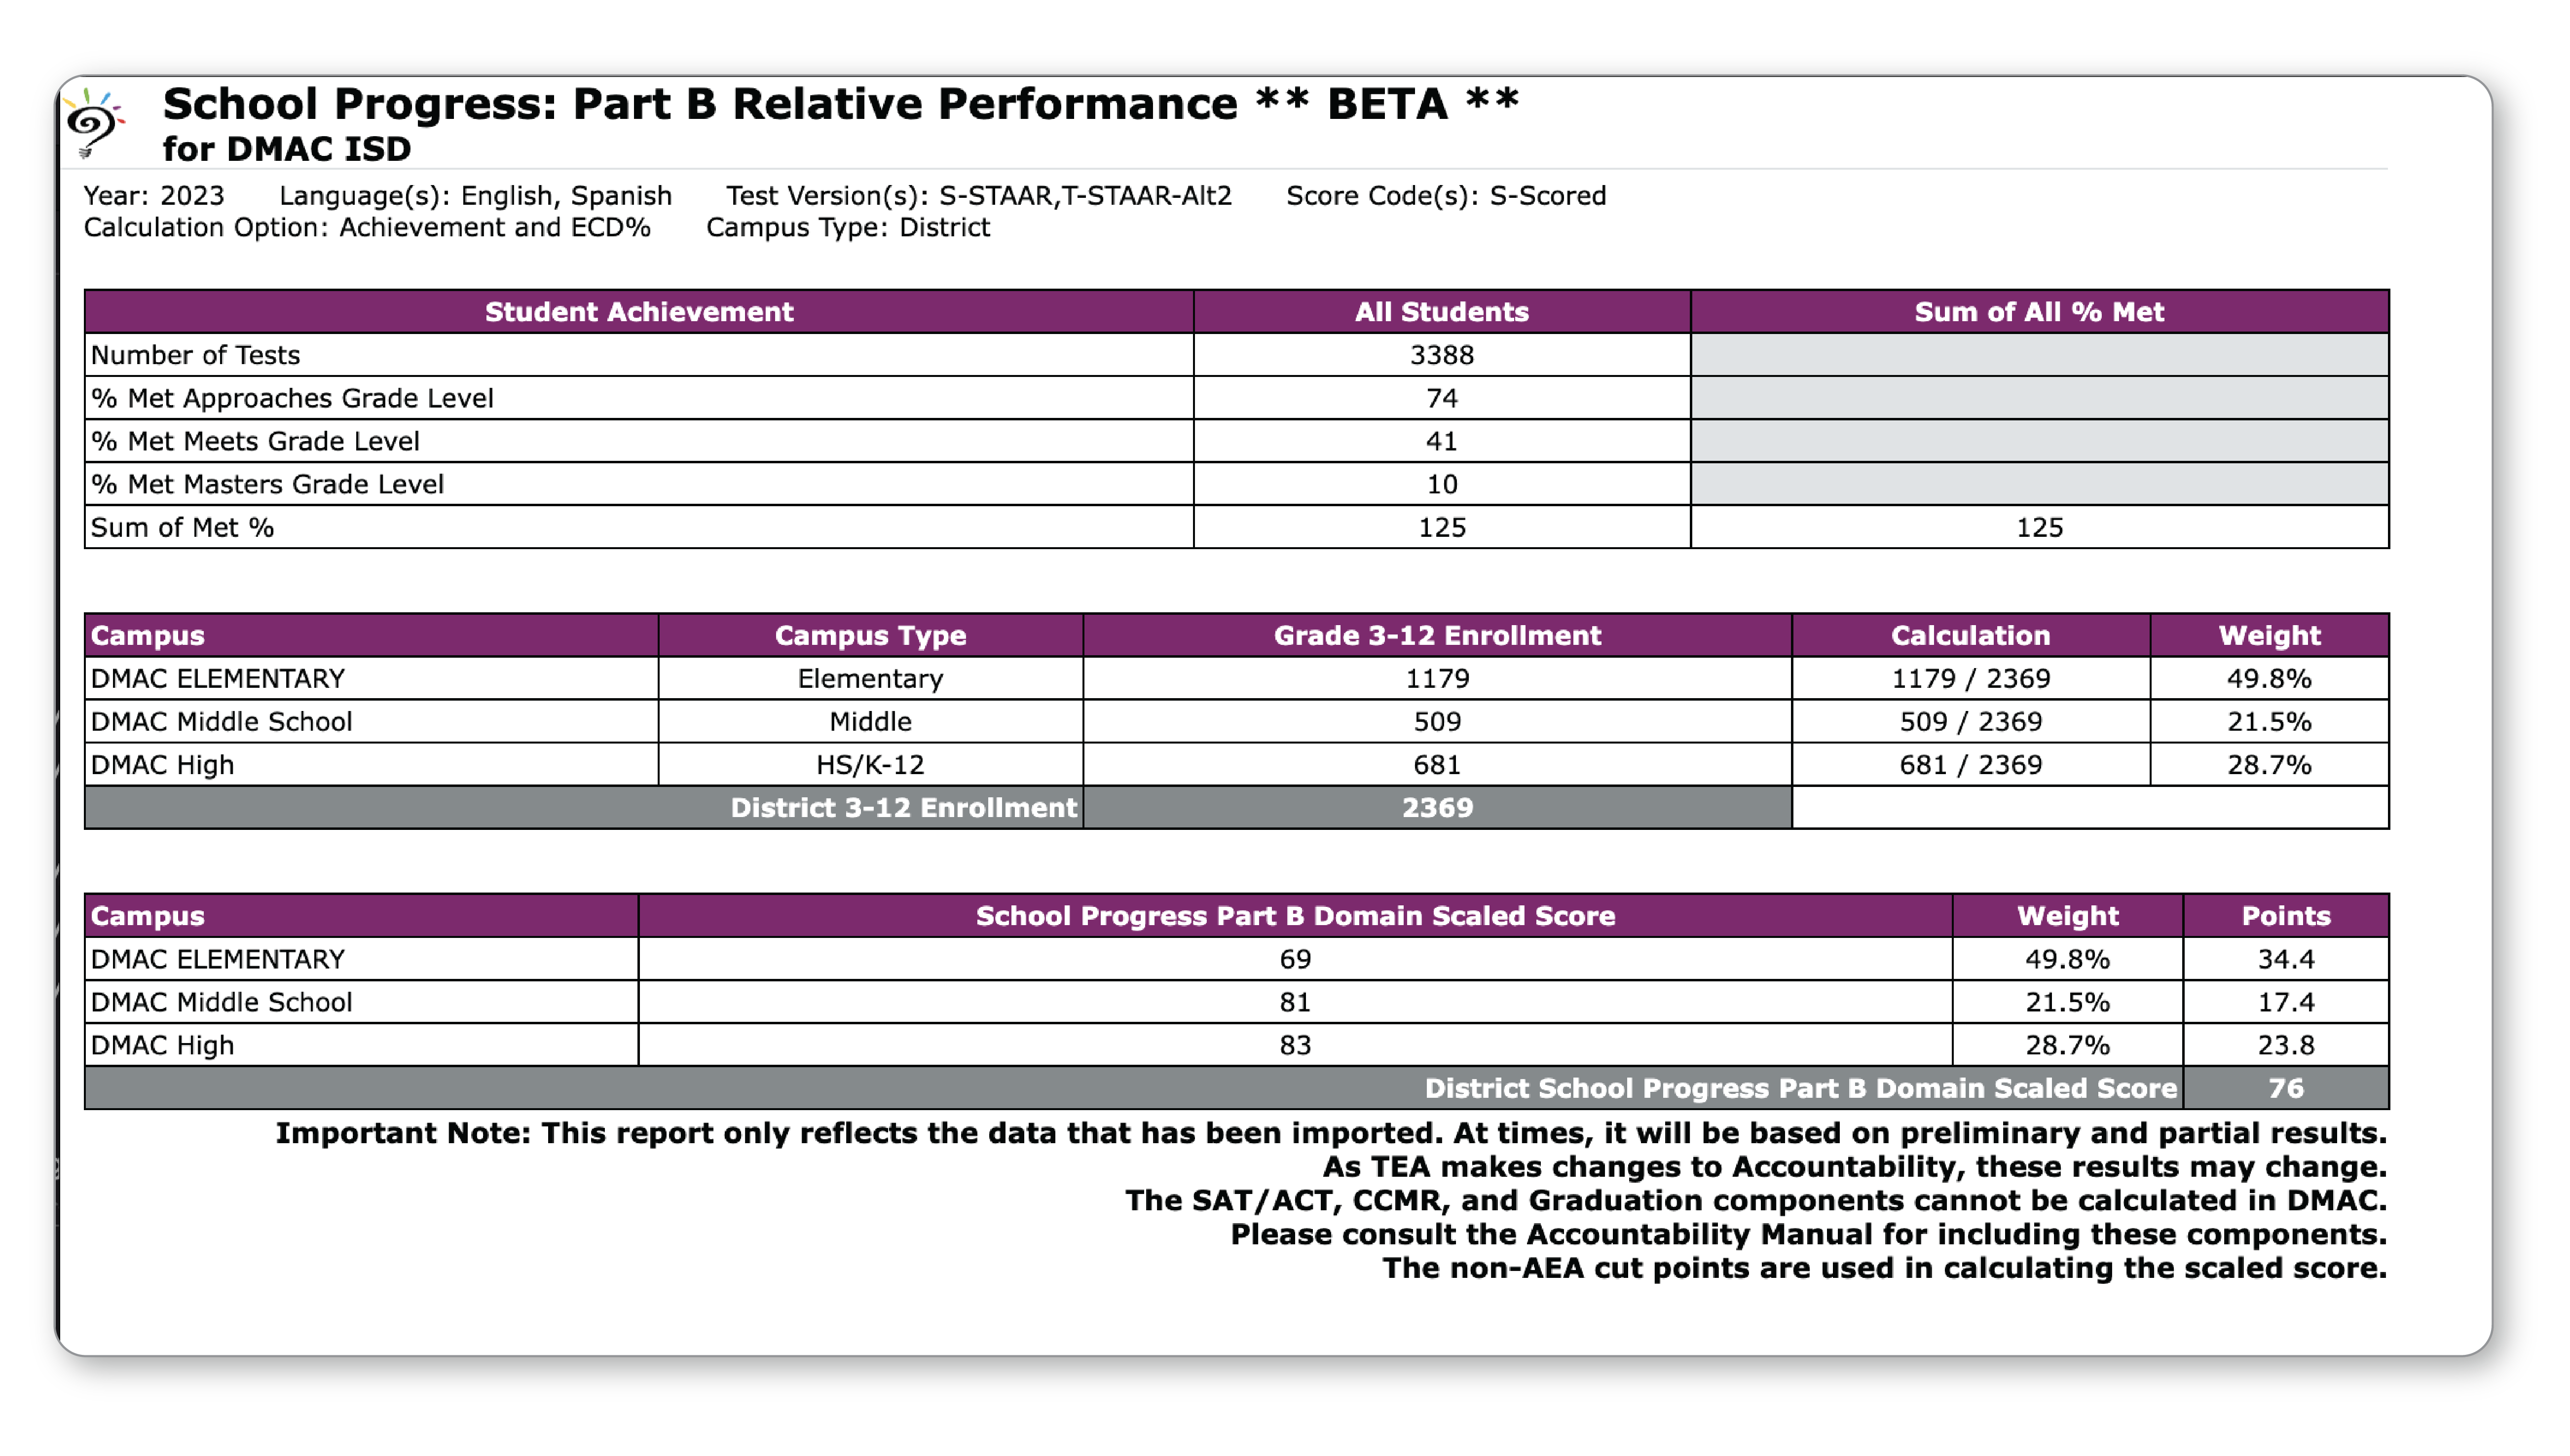
DEMOGRAPHIC | School Progress: Part B Relative Performance
This report shows the achievement of all students relative to districts or campuses with similar economically disadvantaged percentages.
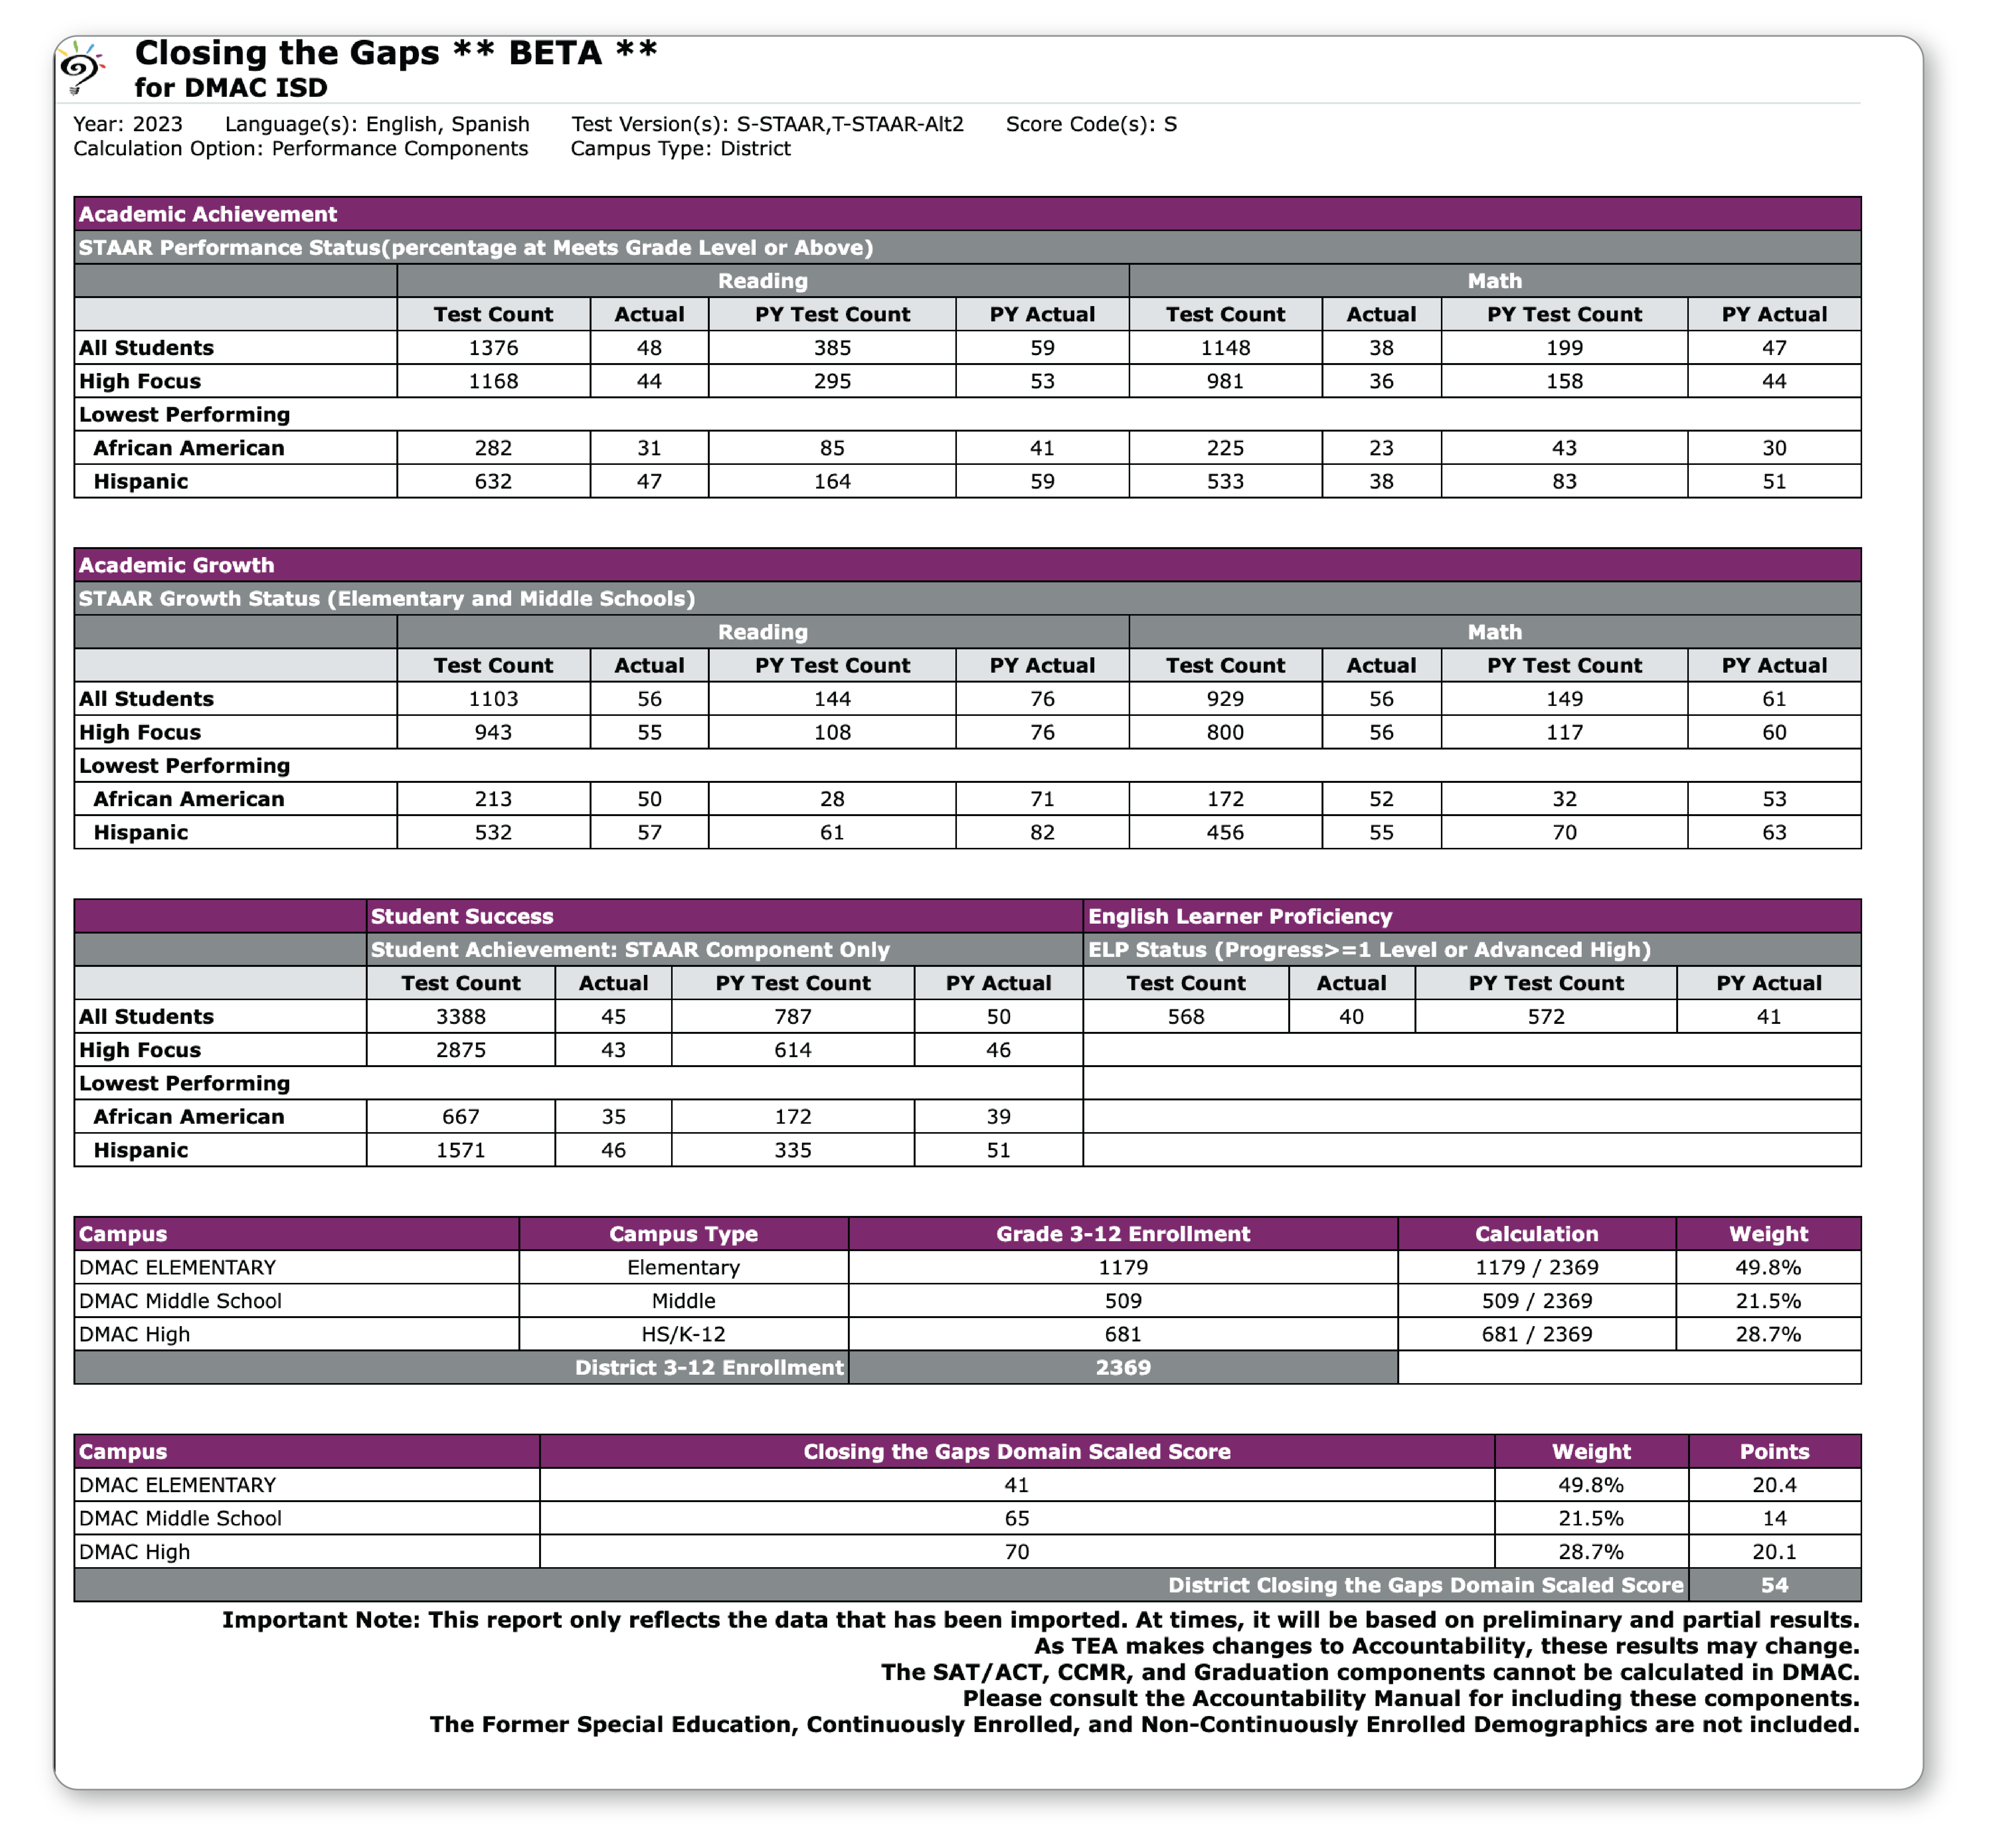
DEMOGRAPHIC | Closing the Gaps
This report uses disaggregated data to demonstrate differentials among racial/ethnic groups, socioeconomic backgrounds and other factors to compare performance to state-established targets.
Click for more State Assessment resources.