 Students
 Educators
T-TESS and TIA
Reports are available through DMAC’s Appraisals application for T-TESS to help schools with documentation for the Texas Incentive Allotment (TIA). This includes the Skew Report and Correlation Graph that allow you to review trends in teacher observation data and correlations to student growth. Disaggregate dimension ratings by district, campus, appraiser, subject and grade in order to facilitate calibration practices required by TEA for the Teacher Incentive Allotment program.
- Watch video >> https://www.dmac-solutions.net/files/eLearning/TTESS/TTESS-TIA.mp4
- Download handout >> https://www.dmac-solutions.net/files/help/TTESS-TIA.pdf
Skew Reports
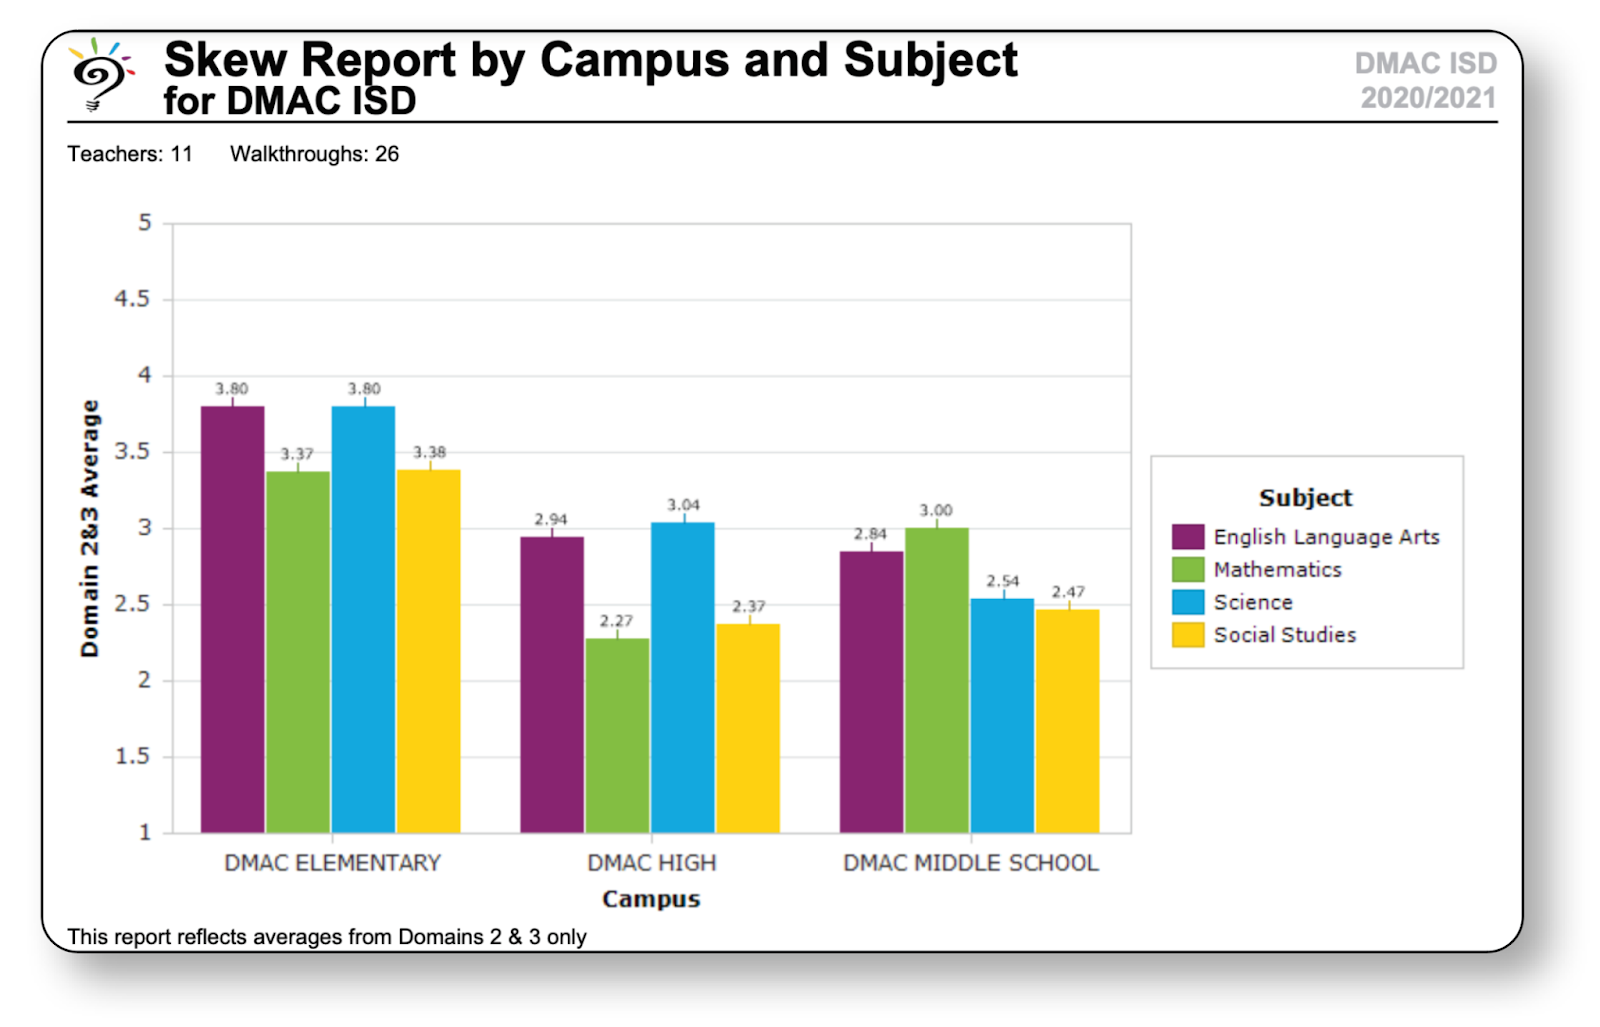
Analyze trends in teacher observation data. Modify the primary and secondary selections to generate a variety of different reports by district, campus, subject, appraiser or grade.
Note: This report reflects averages from Domains 2 & 3
Correlation Graphs
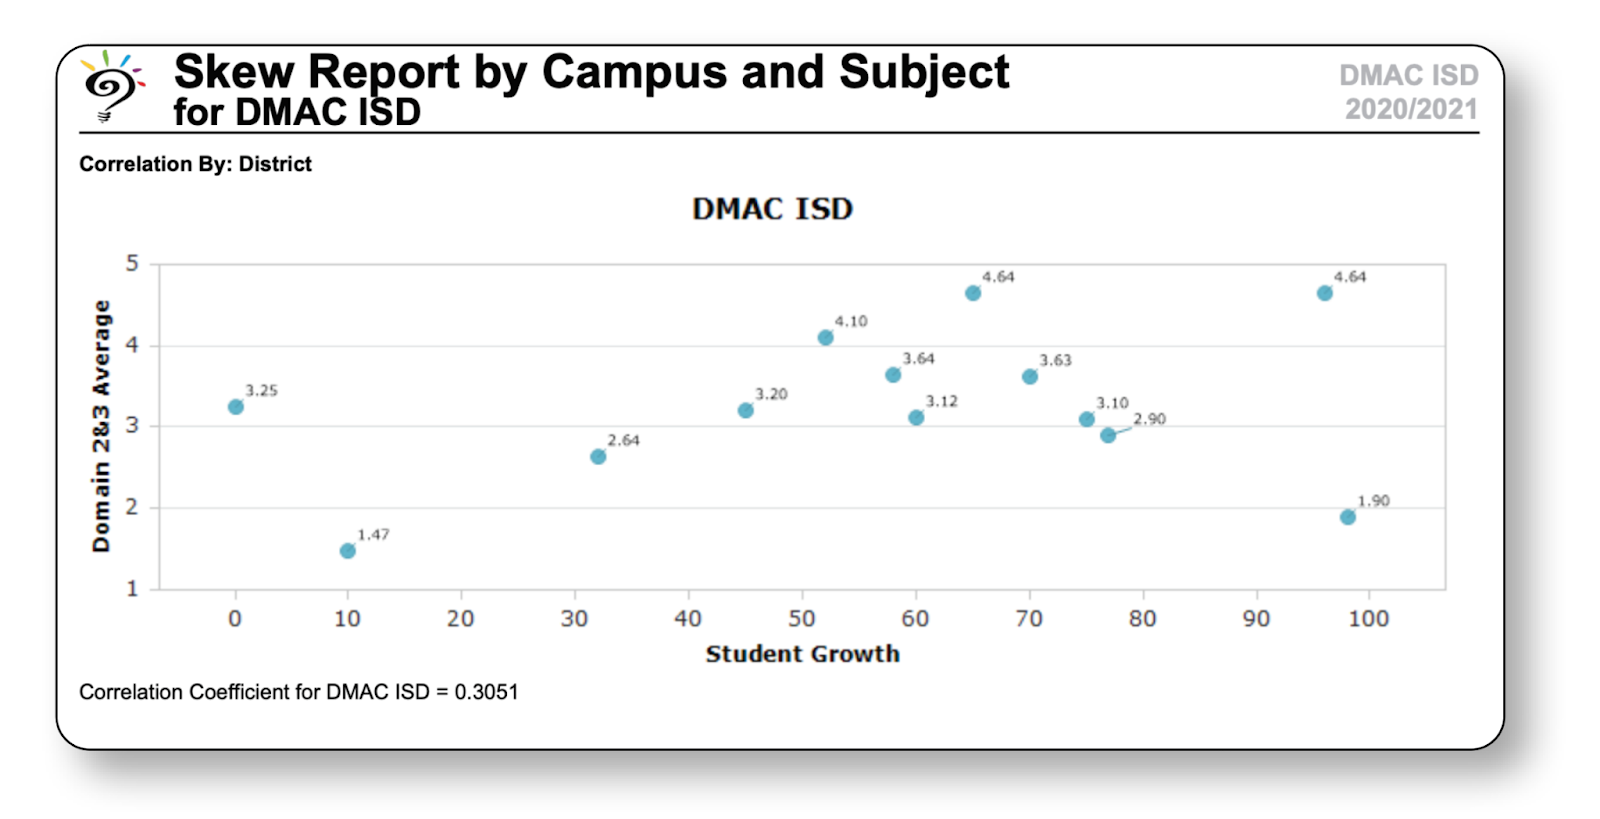
Analyze the correlation between teacher observation data and student growth. Each point on the graph represents one teacher’s observation score and the percentage of students who met their growth target.
Note: This report will also calculate a correlation coefficient between the teacher’s rating and their student’s growth. Ideally, the higher a teacher is rated, the higher their growth percentage will be. Schools will want to see a positive trend on this report to ensure they have calibrated their processes correctly for the Texas Incentive Allotment (TIA) program.
We are here to help!
Contact us if you would like to schedule a webinar to learn how to best utilize the T-TESS application at your school. You can also reach the DMAC Help Desk at 1.866.988.6777 or support@dmac-solutions.net with any other questions.